Data analysis and visualization
Take quick and informed decisions based on the analysis of timely and quality data.
Analyze and visualize key indicators, disaggregations and progress, from project outputs to strategic impact.
Centralize and aggregate results from multiple sources from project to global level.
Real-time developments at a glance
Analyze and visualize data as they are collected
- Analyze and display real-time data in pivot tables, charts and maps.
- Combine analysis in notebooks and dashboards.
- Connect to advanced visualization tools such as PowerBI, ArcGIS, QGIS and more.
- Export and analyze data further using JavaScript, R, Java, Python, and other languages.
Cooperate internally or share your progress with the public
- Add reports in databases and create a single source of information for your organization.
- Control who views reports with permissions based on the users’ roles and resource access.
- Publish reports and make them available to anyone online.
- Embed reports on your website or get a webpage that anyone can access.
Take timely, informed decisions based on quality data
- Store and view millions of records securely and avoid time-consuming, error-prone data transfers.
- View data in real-time for quick insights and support decision-making.
- Get a high level or detailed overview of data with tables, maps and charts.
- Integrate with other software and plan ahead for your whole programme.
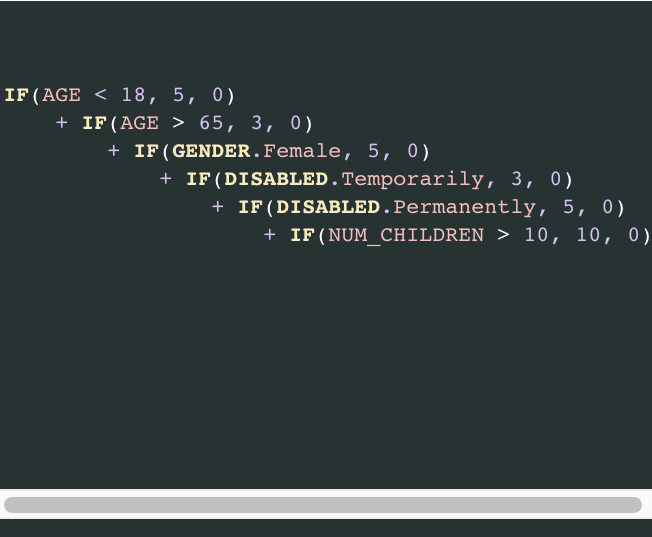
Calculated fields, measures and formulas
Automatically calculate key numbers based on the data you collect. Get aggregated and disaggregated data, risk scores and many more as data comes in.
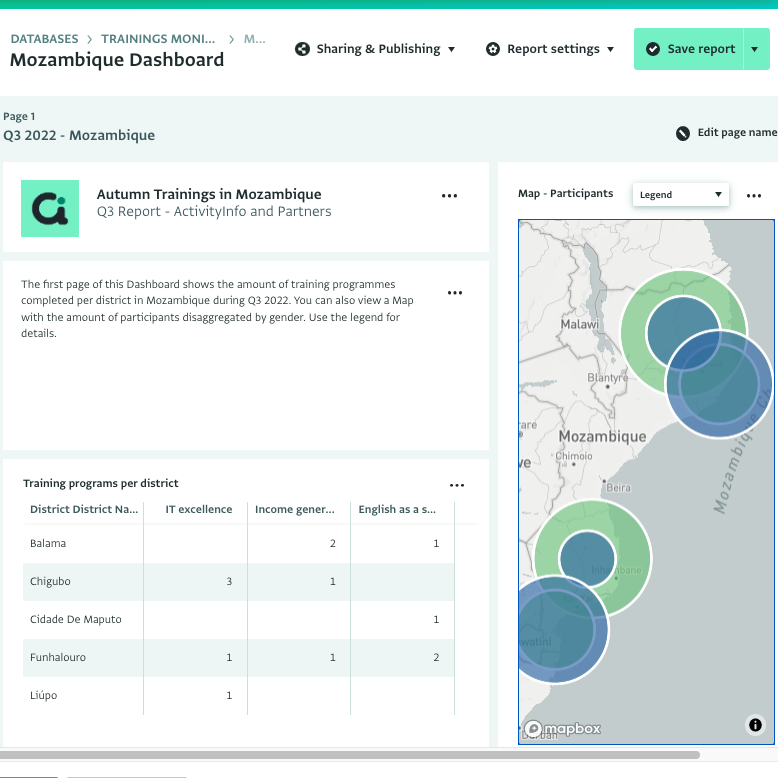
Dashboards
Combine visualizations and tables to get quick insights and support decision-making.
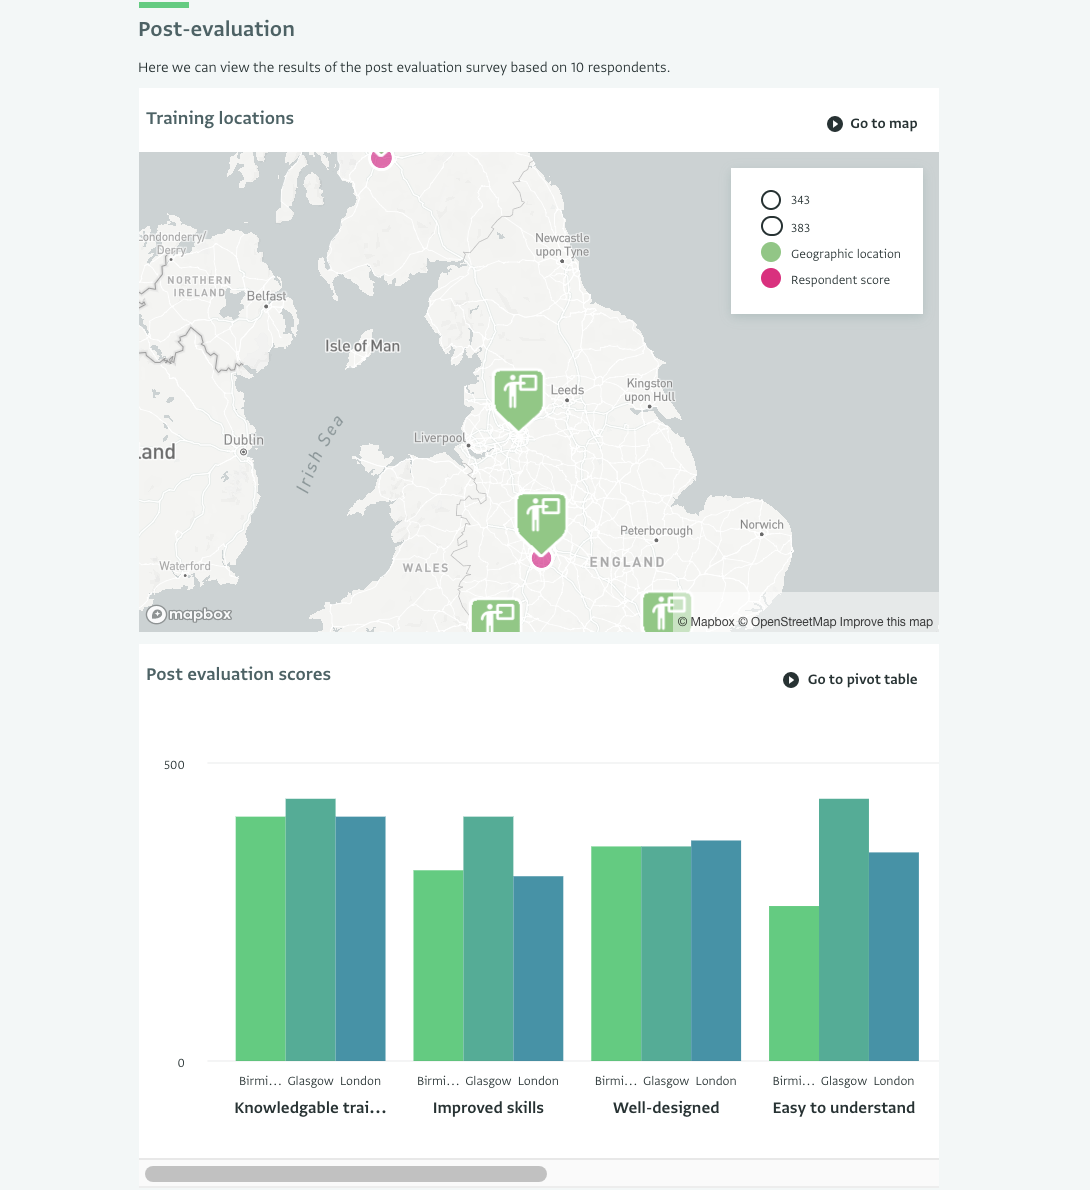
Notebooks
Combine analyses together in comprehensive reports for a complete overview of your progress.
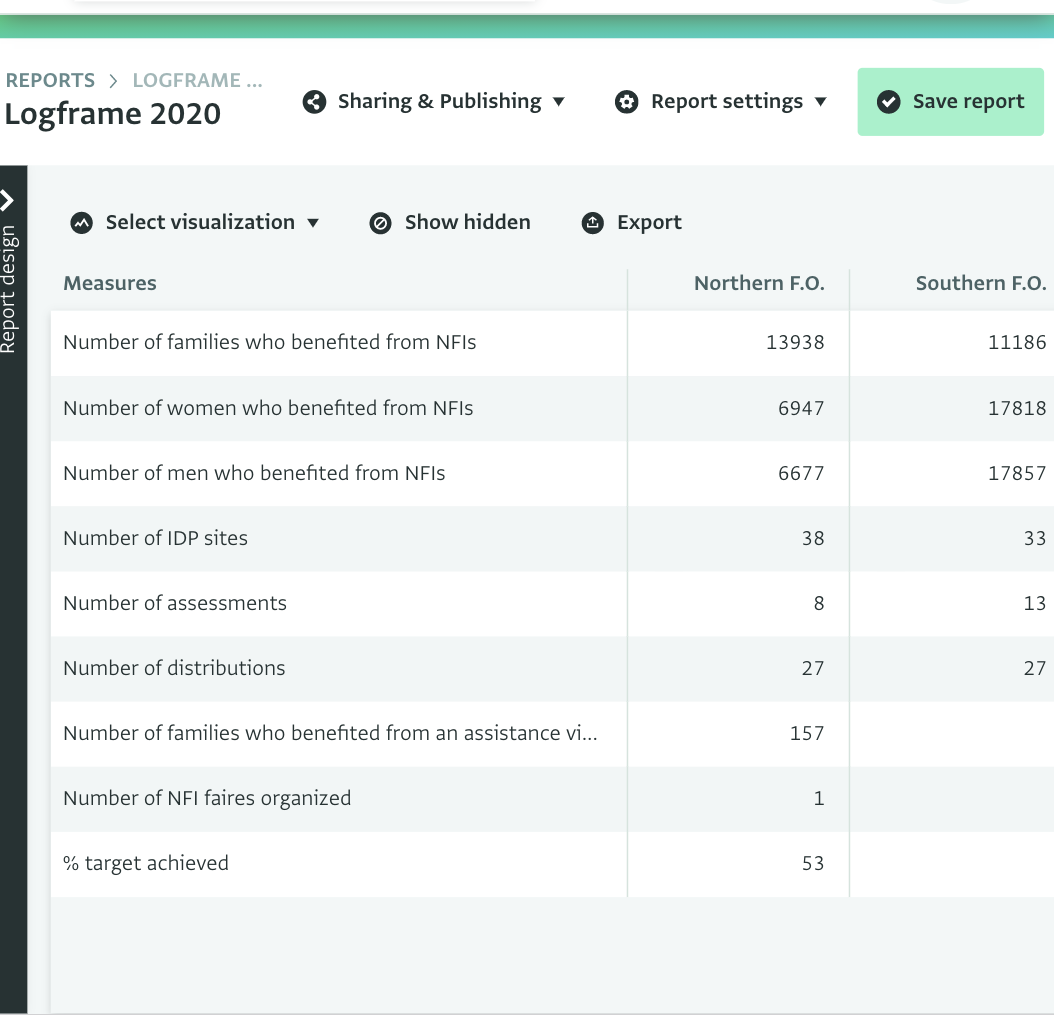
Pivot tables
Use powerful pivot tables to analyze data collected in one or multiple forms. Quickly get percentages, totals, blank values. View statistics such as sum, average, count, count distinct, median, mid and max.
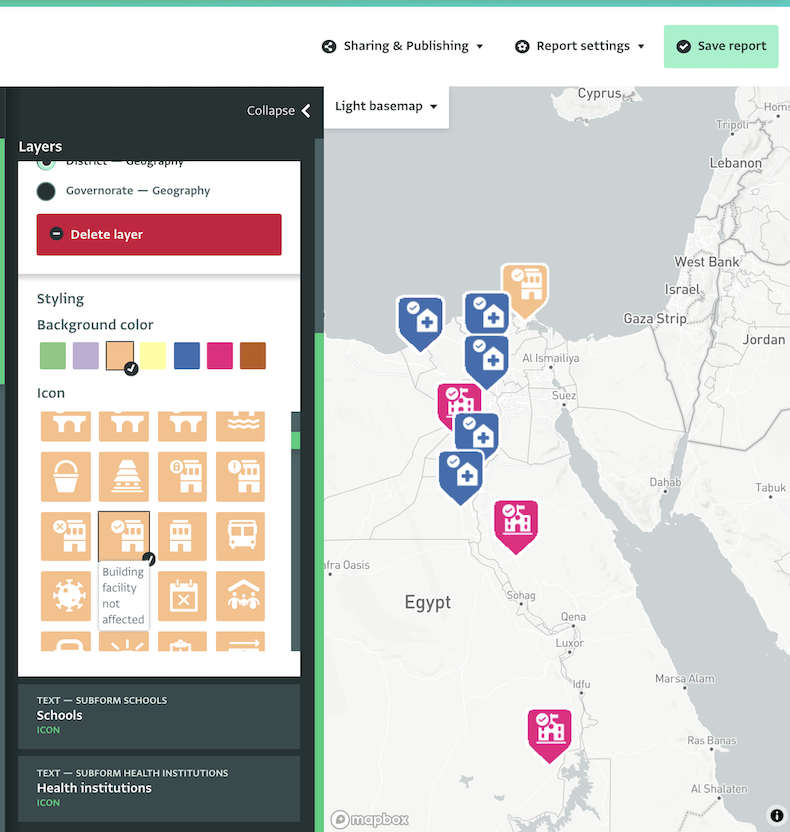
Maps
Map data related to geographical points or connected to the built-in geodatabase in user-friendly maps.
RESTful API
ActivityInfo offers a JSON-based API that mostly follows RESTful principles, so you can either use your favorite REST client library to send and receive JSON, or you can use a client library for R for convenience. You can query records, add, edit or delete records, update the design of a form, add, edit and delete users and much more.
Feel confident with your system
SaaS version: Secured using world-class data centers
- Our company is ISO 27001 certified. This is the internationally recognized Information Security Management standard.
- Data is securely hosted in Google’s world-class secure data centers, located in Europe.
- Google’s Cloud Platform, where ActivityInfo is hosted, meets the ISO 27001:2022, a comprehensive international security certification which is verified by an external auditor and checked regularly thereafter.
Self-managed Server: ActivityInfo's capabilities on your own server or cloud account
- Install ActivityInfo on premise on Windows or Linux or on your own cloud account.
- Run ActivityInfo on a network not accessible via the public internet, including air-gapped networks.
A centralized Management Information System (MIS) for country programmes monitoring
- Organization
- AVSI Foundation
- Using ActivityInfo
- 2020 — Today
- Reasons for choosing ActivityInfo
-
- Easy M&E database design
- Simplified data entry storage
- Simplified data analysis
- Cost-effective aggregation of all data levels
- Mobile data collection
- Flexibility
“The beauty with ActivityInfo is that it is really simplified, to the point that you don’t need any technical capacity to be able to understand it. So even a training of two hours or maybe even less is enough for people to learn how to enter data.”
John Paul Nyeko, Monitoring and Evaluation advisor, AVSI Foundation