Language: English
This article describes how to design a Report using the Notebook layout.
A Notebook is a collection of tables, charts, and maps along with text and section headings. Notebooks allow administrators and data analysts to combine individual analysis or visualizations into a coherent narrative structure.
The Notebooks you design are visible only to you unless you add them to a Database, share or publish them.
Learn everything you need about Notebooks in our Webinar "Using notebooks for comprehensive data analysis in ActivityInfo".
Once you are familiar with Notebooks, master the feature by completing the guide "Creating a Notebook for 3W activities".
How to add a Notebook
To design a Report using the Notebook layout, follow these steps:
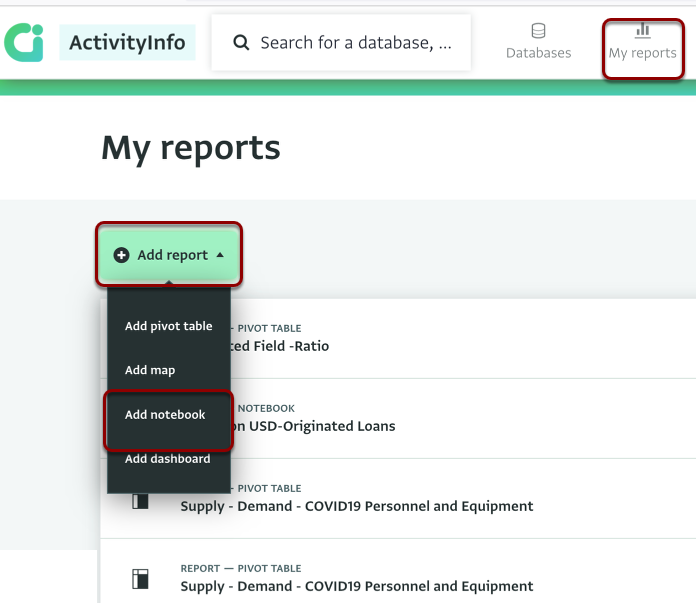
- Navigate to "My reports"
- Click "Add report" and select the "Add notebook" option.
- Select the resource(s) on which you want the analyses of the Notebook to be based on. The resource(s) can be the content of one or more Databases, Folders or Forms. Depending on what you want to use as your source you can drill down the list to reach a specific Form or select all the contents available instead.
- When you have selected all the sources you need click on the "Done" button.
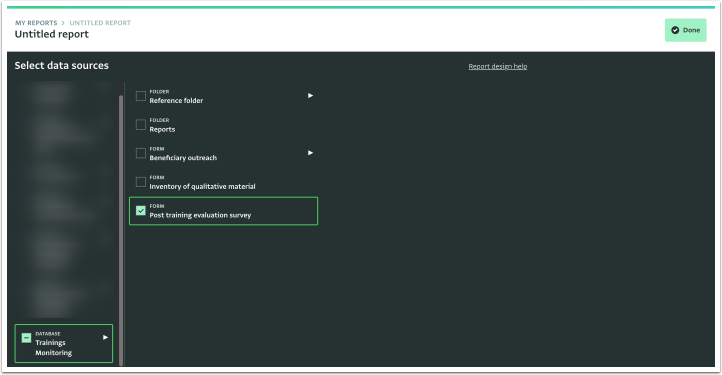
- To reach a specific Form, click on "Databases" to reveal the list of the available Databases and select the Database(s) that contains the Folder(s) or the Form(s) you want.
- If the Form belongs to a Folder, select the Folder from the list of Folders to reveal the list of Forms in it.
- Alternatively, to use the data of all the Databases, click on the Databases box to select all Databases.
Add a Heading
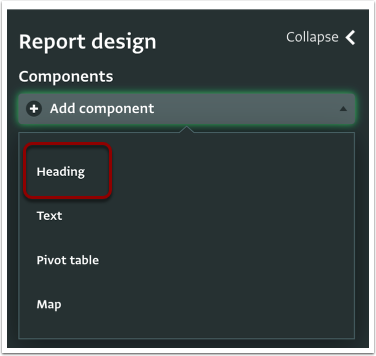
To add a Heading to the Notebook you just created, follow these steps:
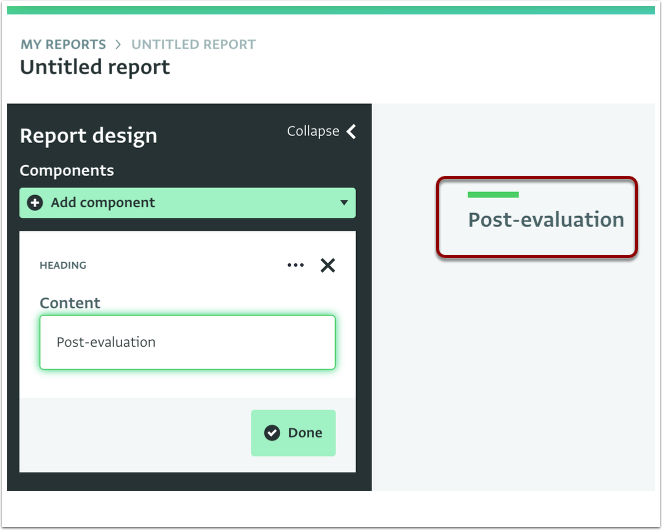
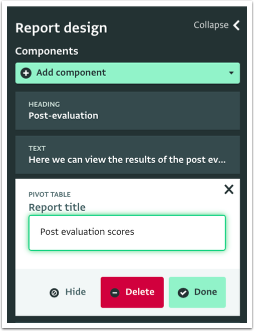
- Click on "Add component" and select the "Heading" option.
- Type in the name of the heading, “Post-evaluation” in this example.
- Click on "Done" to close the card and continue adding components.
- The Heading appears in the Notebook.
- Continue adding as many Headings as you need.
Add Text
After you created the Notebook, and added the necessary Headers, add the Text component.
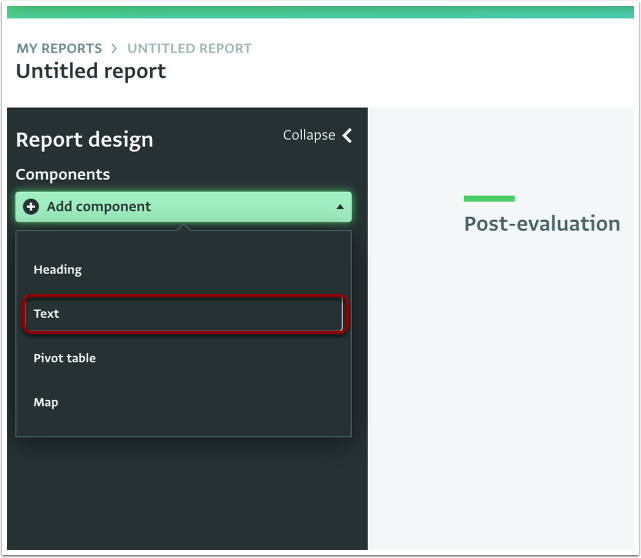
- Click on "Add component" and select the "Text" option.
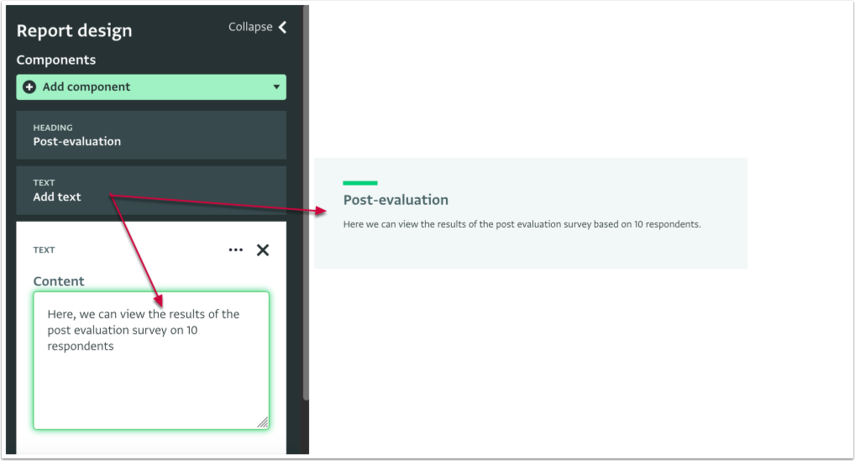
- Type the text you want to add and click on "Done" to close the card and continue adding components.
- The text appears in the Notebook.
- Continue adding as many Text components as you need.
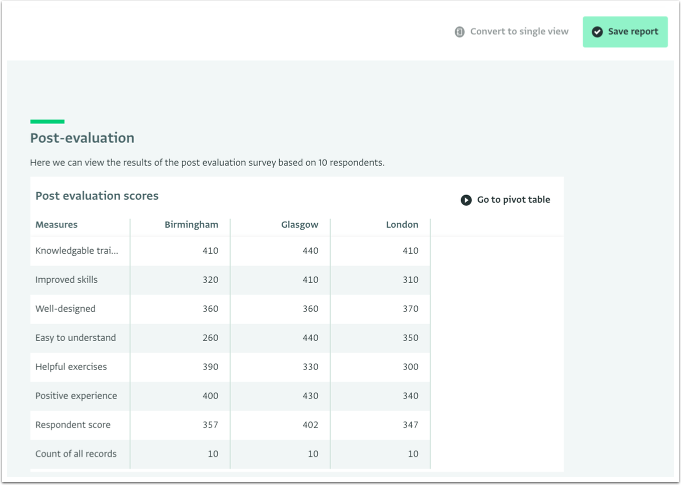
Add a Pivot Table or a Bar Chart visualization
Continue the Report design by adding a Bar Chart visualization to the Notebook using a Pivot Table:
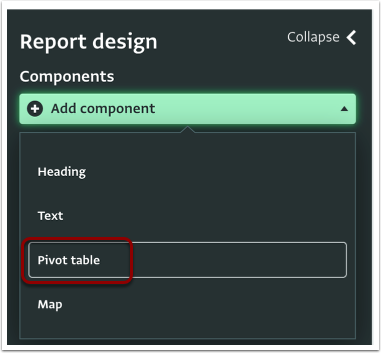
- Click on "Add component" and select the "Pivot Table" option.
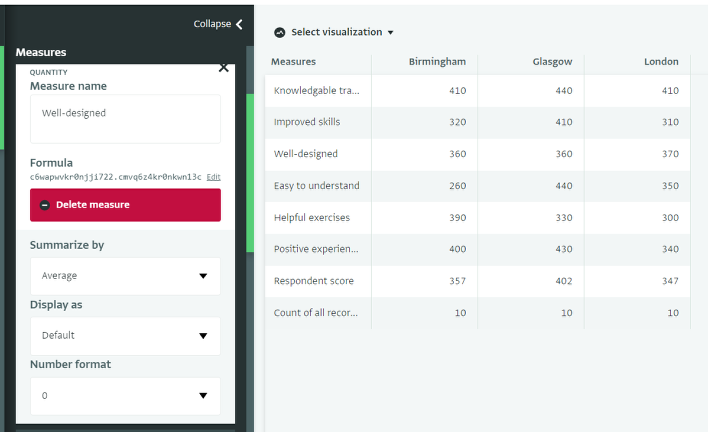
- In the Analysis View you can start designing the Pivot Table or the Bar Chart by adding Measures and Dimensions. Drag and drop the Measures and Dimensions you want to use.
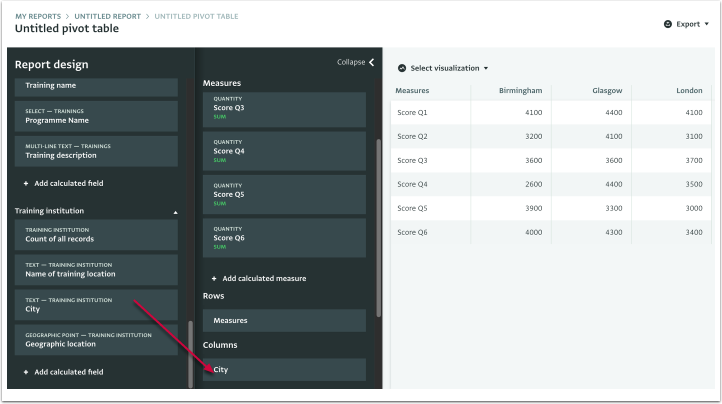
- Apply changes to the Statistics, Labels and Headings, if needed.
- You can add Calculated fields or the count of all Records, if needed.
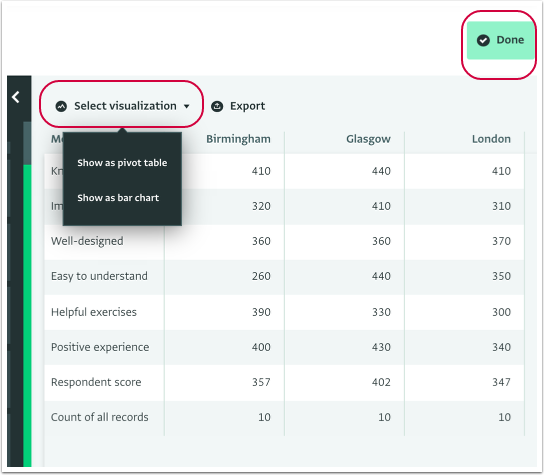
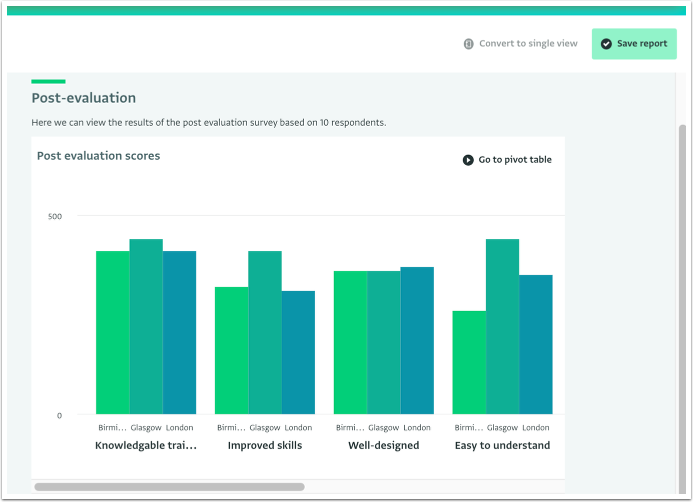
- Click “Select visualization” and switch from “Show as Pivot Table” to “Show as bar chart.”
- Click "Done" to apply the changes.
- To add more resources, click "Select forms" in the Report Design side panel.
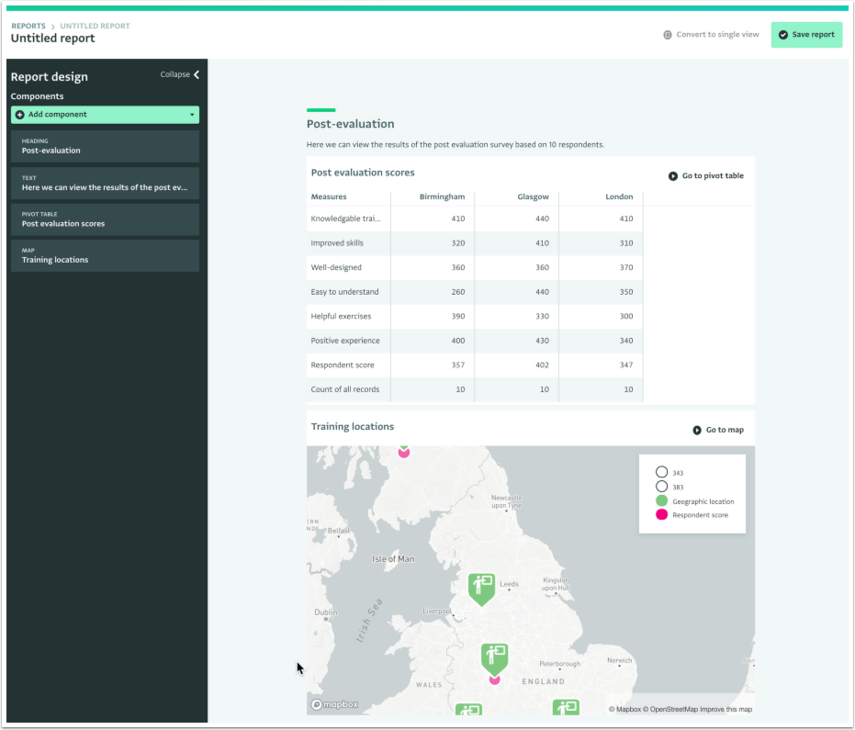
- The visualization has been added to the Notebook.
- Click on the component card to give a name to the newly added Report and click on "Done" to save it.
- To continue working on the analysis, click "Go to pivot table" and make the adjustments in the Analysis View.
- Add as many Pivot Table and Bar Chart visualizations as you need.
Add a Map visualization
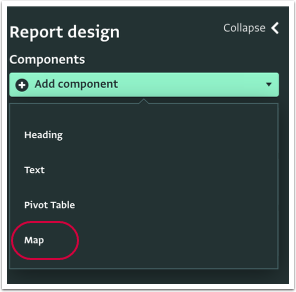
To add a Map visualization to the Notebook, follow these steps:
- Click on "Add component" and select the "Map" option.
To be able to add a Map, the resources you are using need to contain Geography sources.
- You can collect geographic information using a Geographic Point field to collect specific coordinates or by referencing the built-in geographic Database of ActivityInfo to collect information related to a geographic area.
- In the Analysis View you can click on “Select forms” to add more Forms as resources or use the ones you have already selected.
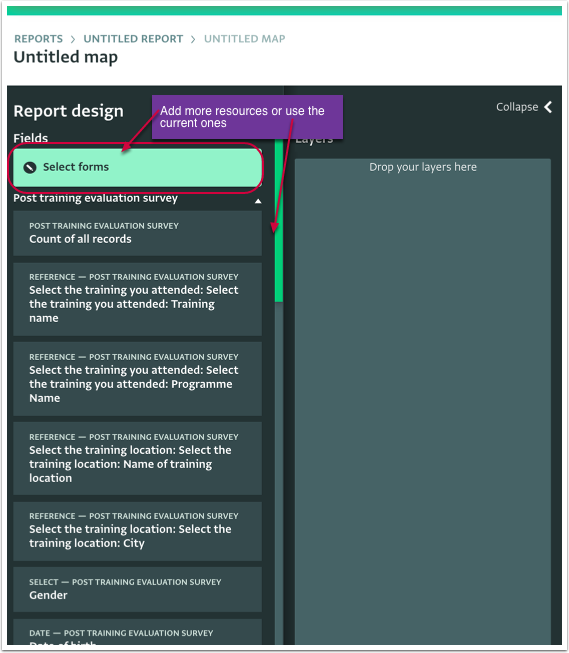
- Drag and drop the Layers you want to use in the Map.
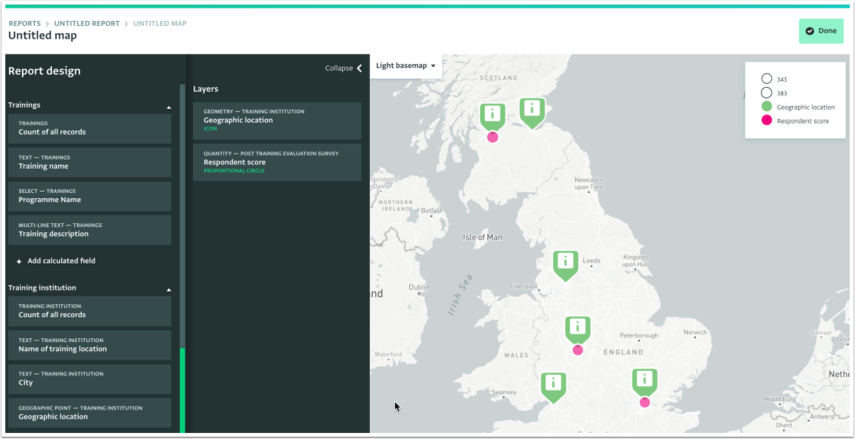
- Apply changes to the Labels, Statistics, Colors, Icons etc.
- Click "Done" to apply the changes.
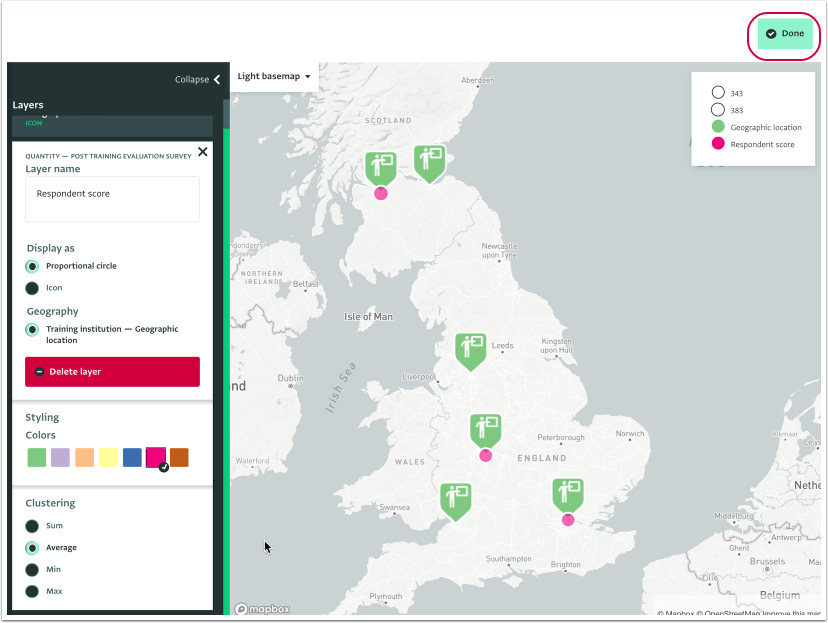
- The Map is added to the Notebook.
- Click on the component card to give a name to the newly added Report and click on "Done" to save it.
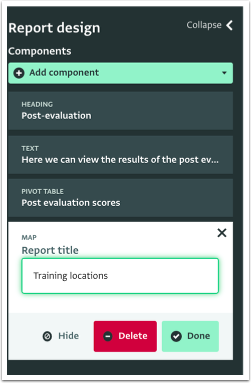
- To continue working on the analysis, click "Go to map" and make the adjustments in the Analysis View.
- Add as many Map visualizations as you need.
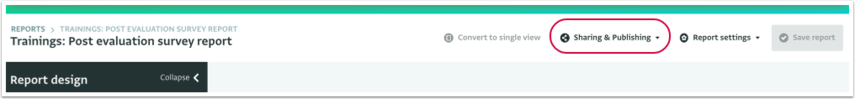
Save and Share or Publish the Notebook
When you have added all the components you need to the Notebook, you can name your Notebook and select where to save it to. You can choose to share the Report, which means publishing it to a Database or Folder; or keep the Report for personal use only.
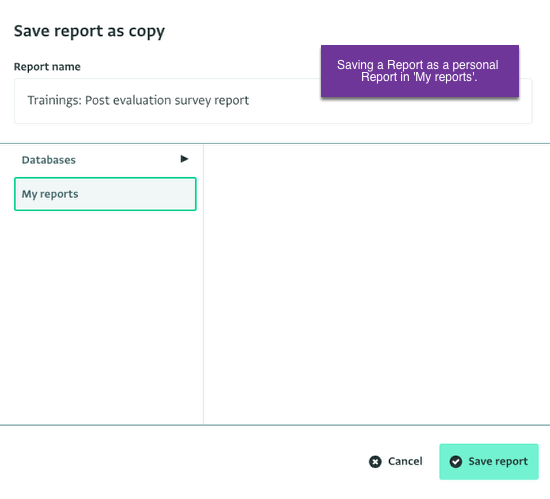
Click "Save report" and pick from the following options:
- To save a Report as a personal report select “My reports” and click on “Save report.” You can choose to publish a personal Report at a later point in time as well.
- To save a Report to a Database or Folder, navigate to the Database and/or folder you want, click on it to select it and click on “Save report.” Once saved, you can view it in the Report List page, if it's saved as a personal report in “My reports” or in the Database page or Database Settings page, if it's added to a Database.
- You can publish a personal Report at a later point in time as well by clicking the “Sharing & Publishing” button.