Creating a Notebook for 3W Activities
You can create various types of reports based on the data you collect or store in ActivityInfo. With our latest release, we made Notebooks available. A Notebook is a collection of tables, charts, and maps which can be combined with text and section headings. Notebooks allow you to bring together individual analysis or visualizations into a coherent narrative structure.
In this Guide we will create a Notebook for 3W (Who did What Where) activities. We will use the 3W database template which includes a small sample of data from the Myanmar consolidated 3W published on HDX. You can also add this database template to your account and practice along with this guide.
Learn more about the template.
We will use the data included in the Form ‘Projects’ to create a Notebook that will contain various pivot tables and maps to show overviews and drill downs for the various activities run by the organizations included in the 3W. We won’t create every possible pivot table and map, instead we will explore some structures which you can adjust to meet your own reporting needs.
More specifically our Notebook will contain:
- A map to introduce the amount of projects in various geographic locations in the country
- A pivot table for all completed projects by partner, sector and admin level
- Pivot tables for all projects under implementation in specific sectors by partner and admin level Headings and text to complement the reports
Don’t forget that in addition to the built-in reporting tools, ActivityInfo offers a RESTful API to allow you to integrate with external software and you can also quickly connect to Power BI to create visualizations out of the data collected or stored in ActivityInfo.
Step 1: Add a Notebook
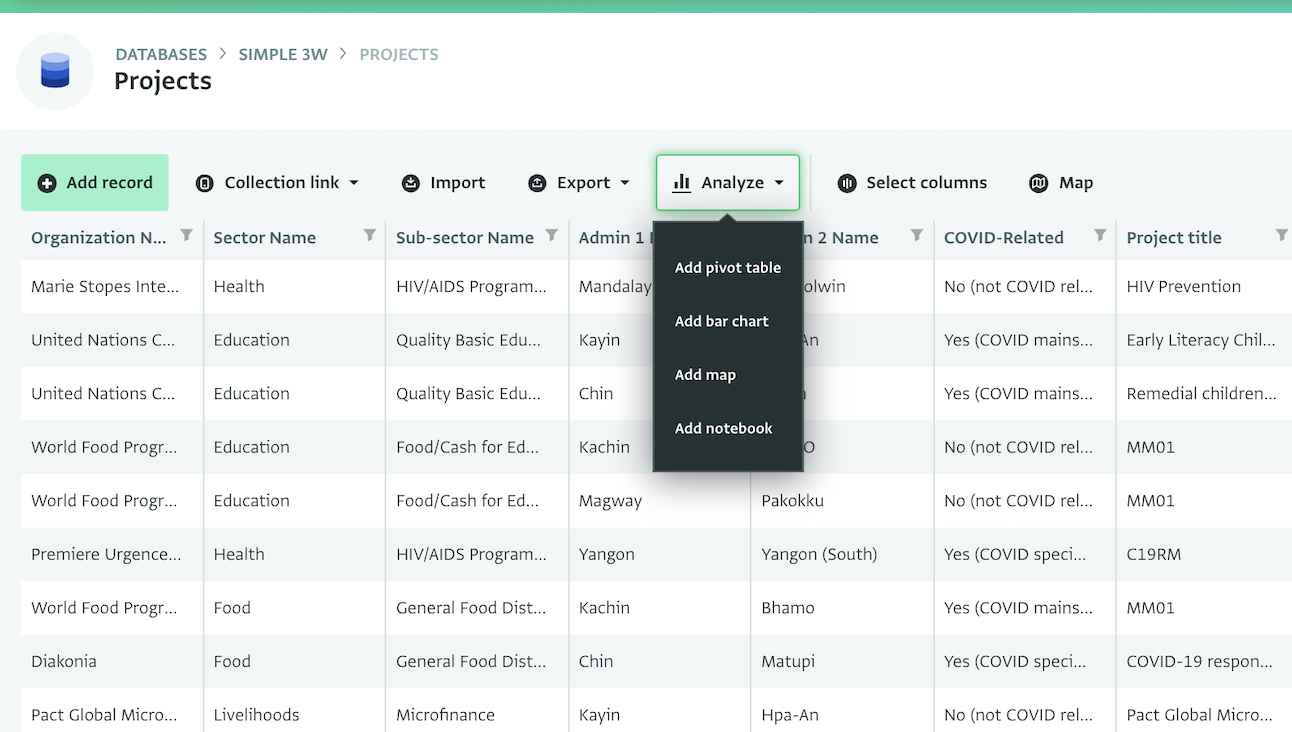
First we will navigate to the Table View of the Form ‘Projects’, we will click on Analysis and we will select ‘Add notebook’ from the drop down menu to add the records of the form as resources for our Notebook.
Step 2: Add a map for all projects
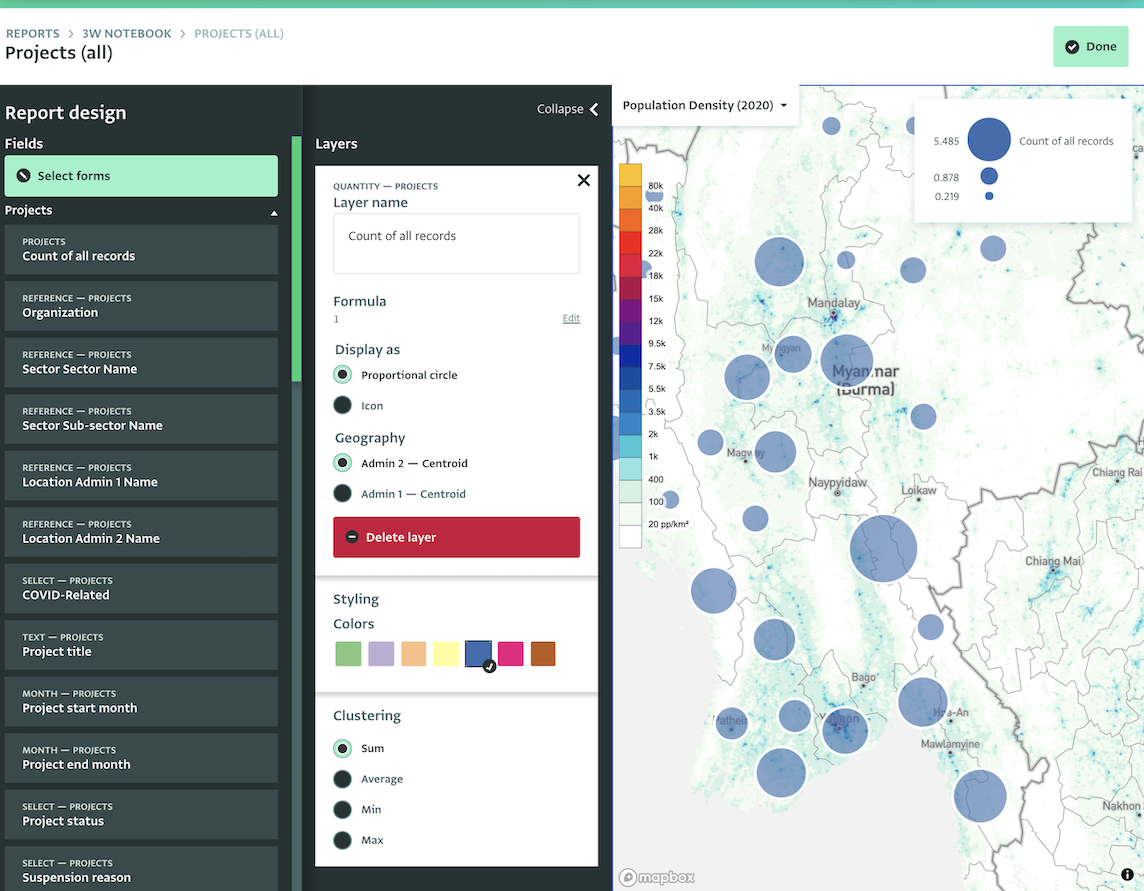
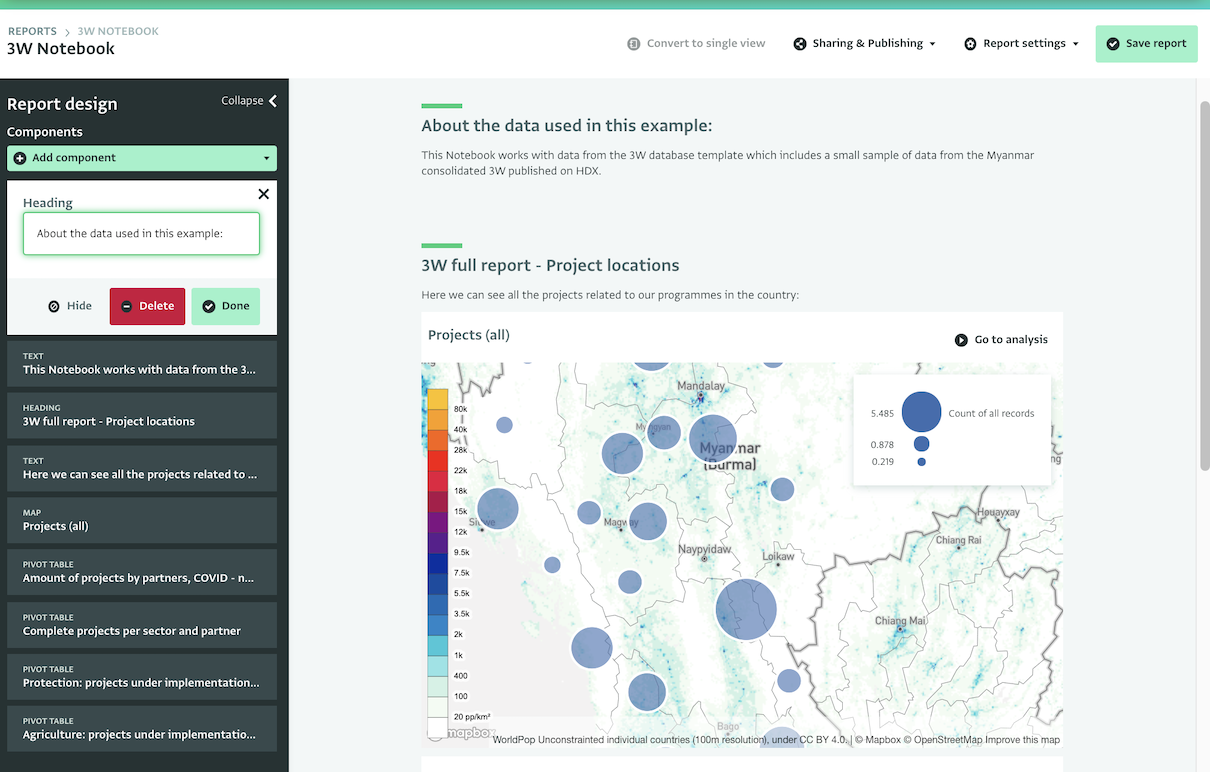
First, we will add a map to show all our projects in the country. To be able to add a map, our form must be collecting geographical data. We can simply add a map by clicking on “Add component” and selecting “Map” from the drop-down menu. Then, we can design the map and we will click on “Done” to add it to our Notebook.
In this example, we will use as a Layer the Count of all records. We will do this because each record corresponds to a project and this allows us to view all projects on the map. We will use proportional circles because we are working with quantitative data and we will cluster the data based on the sum of projects per admin region.
Step 3: Add a pivot table for completed projects per partner and sector
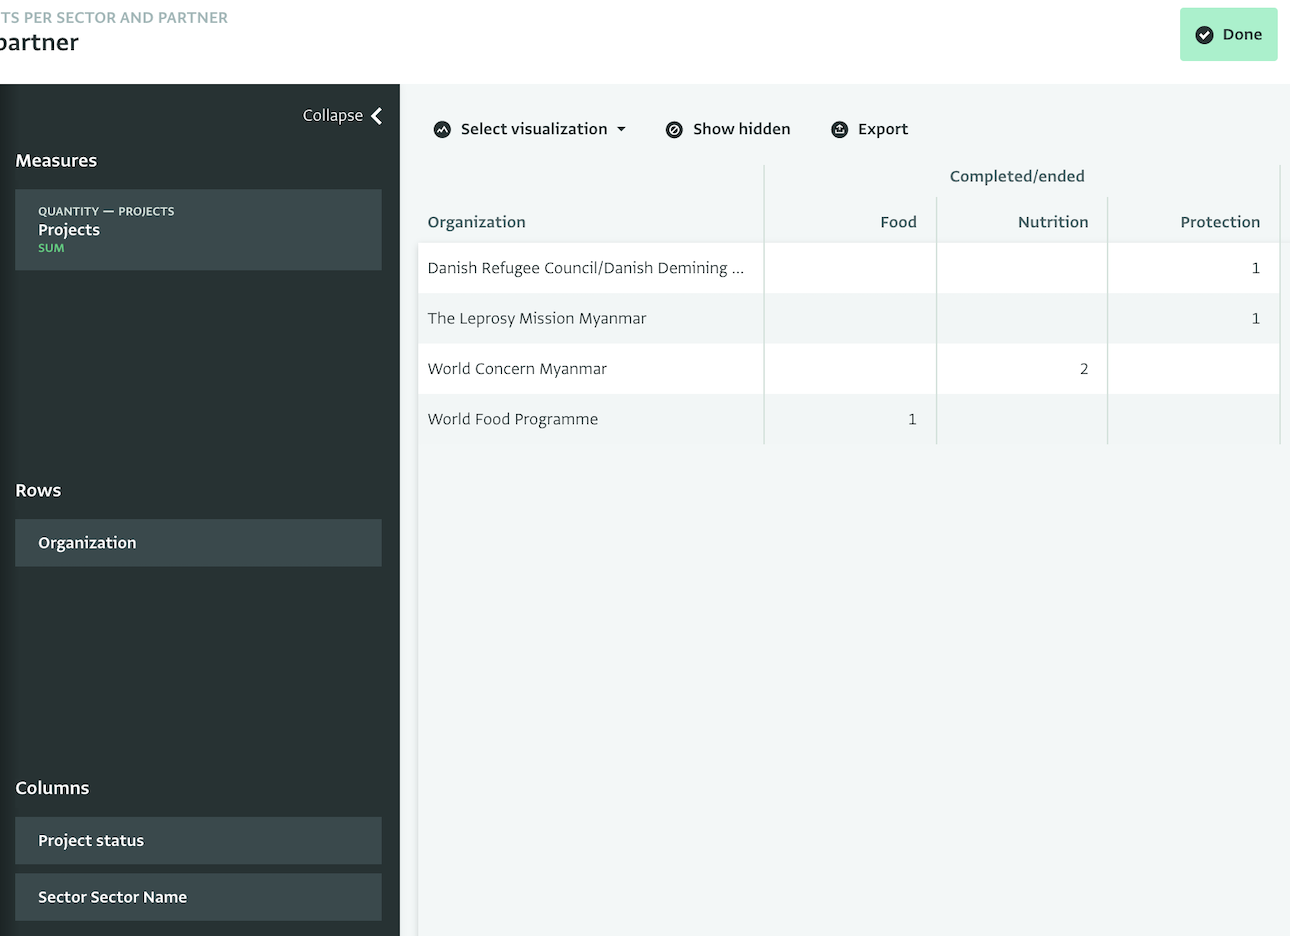
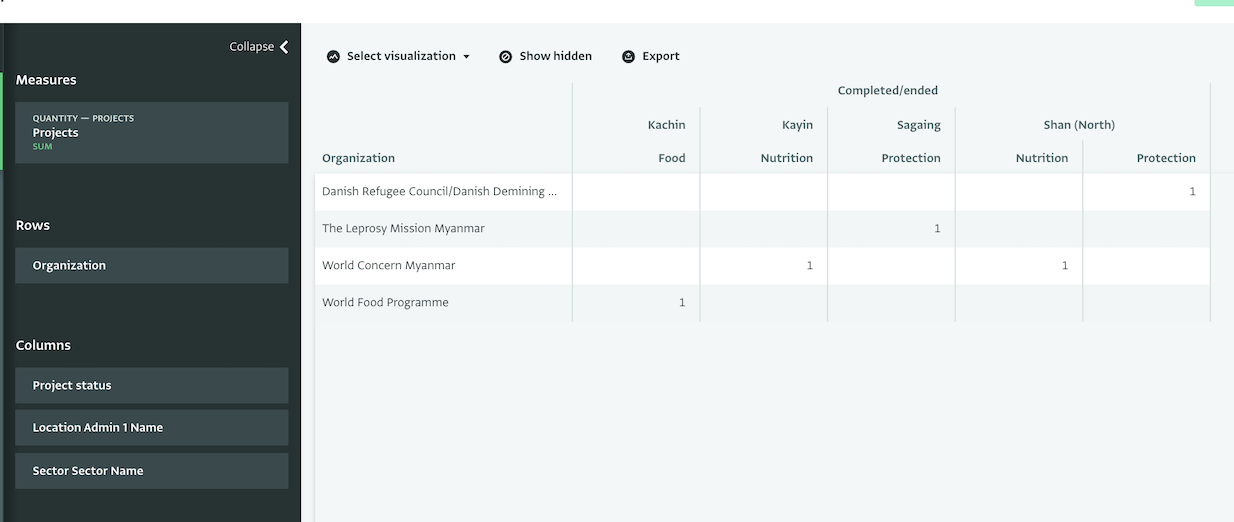
After clicking on “Done” the map is added to the Notebook. Now, we can select "Pivot table" from the drop-down menu with all the components and start working on a pivot table to show only the completed projects for every sector and the partners leading them.
We will add as a Measure the Count of all records which once again corresponds to the number of projects and as Dimensions we will add the Organization (Row) and the Project status and Sector name (Columns).
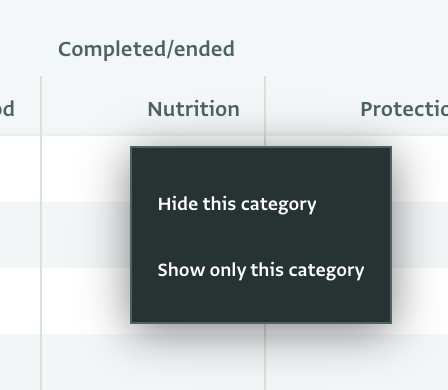
Because we want to narrow the data down and show only the Completed projects we will right click on the ‘Completed/ended’ header and we will click on "Show only this category". Once our pivot table is ready we will click on “Done” to add it to the Notebook. We can also add the Admin level in the Dimensions to provide the location of the completed activities.
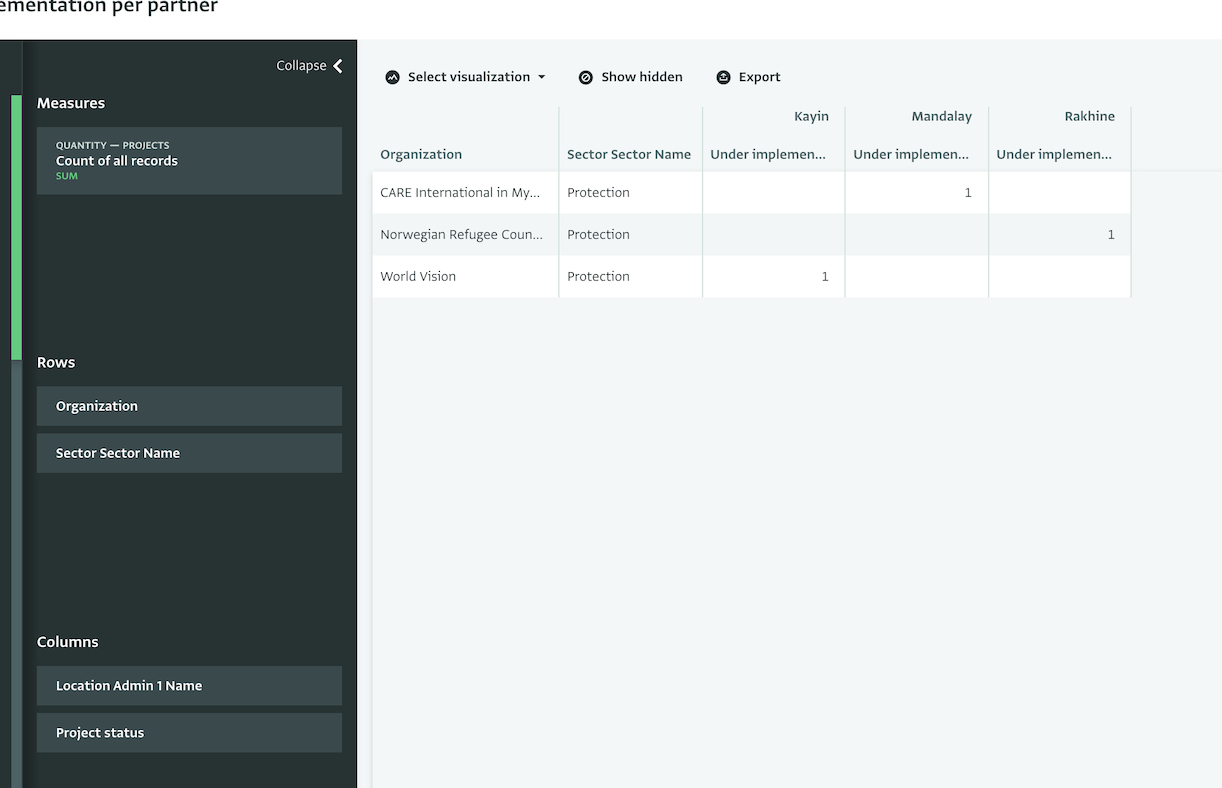
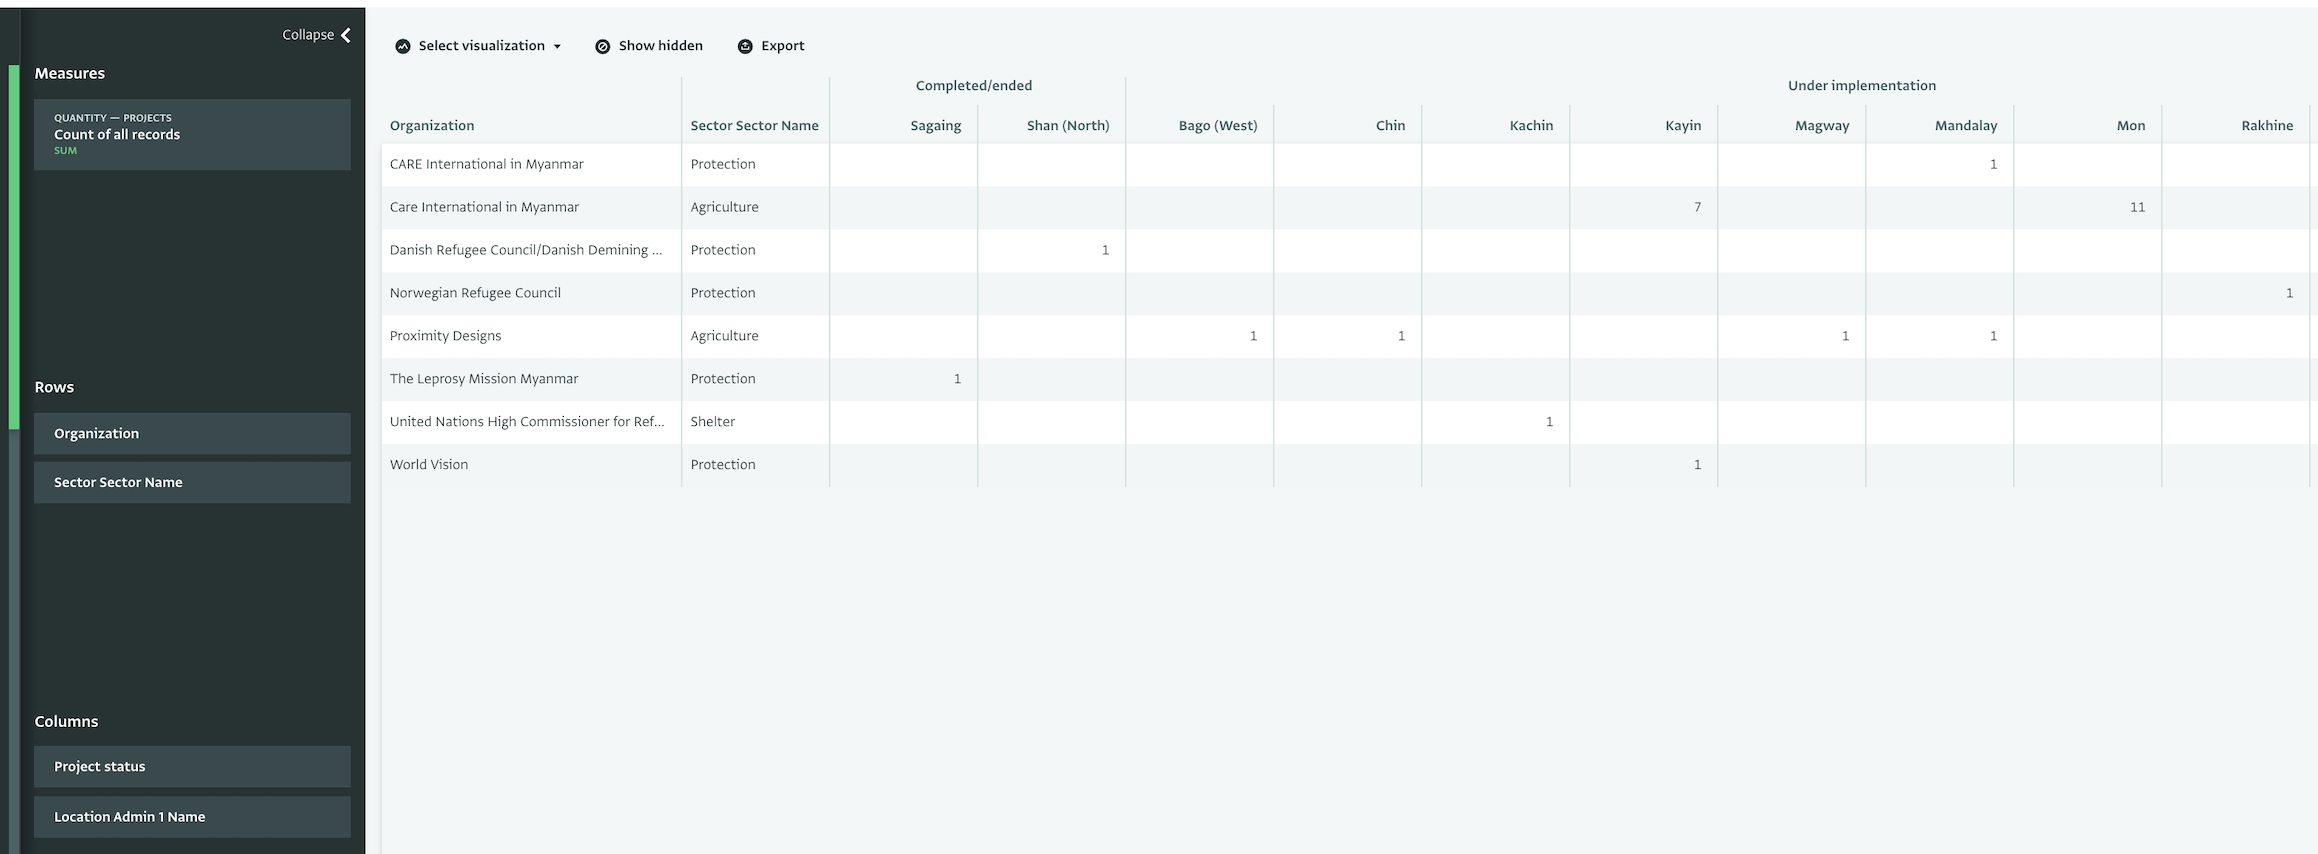
Step 4: Explore a specific Sector by adding a Pivot Table in the Notebook
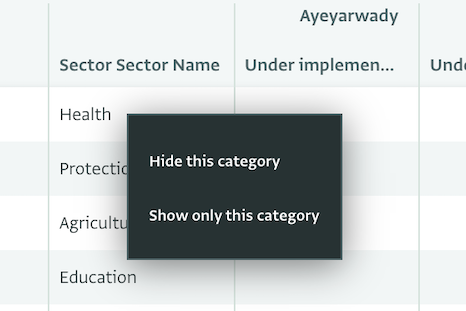
Finally, we can add a pivot table to the Notebook to explore the situation in each specific sector for every geographic location. We can do that by using the dimensions of partner, geographic location and sector and then narrowing down to a specific sector by right clicking and selecting "Show only this category" (i.e. one sector or one admin location). Alternatively, we can show only selected sectors, by clicking on "Hide this category" for all sectors we don’t want to include in the pivot table.
Step 5: Add headings and descriptions to the Notebook
You can add as many maps and pivot tables you need to the Notebook. Following that, you can add headings and texts to complement the various analyses. You can drag and drop the cards to change the sequence of the components on the Notebook and you can delete or hide a component. Finally, if you wish to work more on an analysis or change it completely, you can click on "Go to analysis" to start working with it.
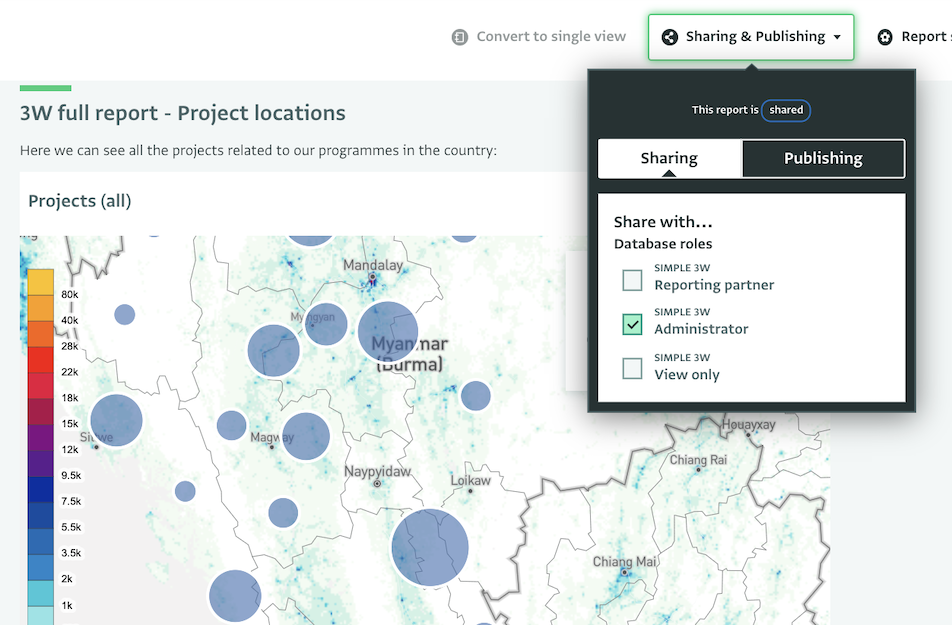
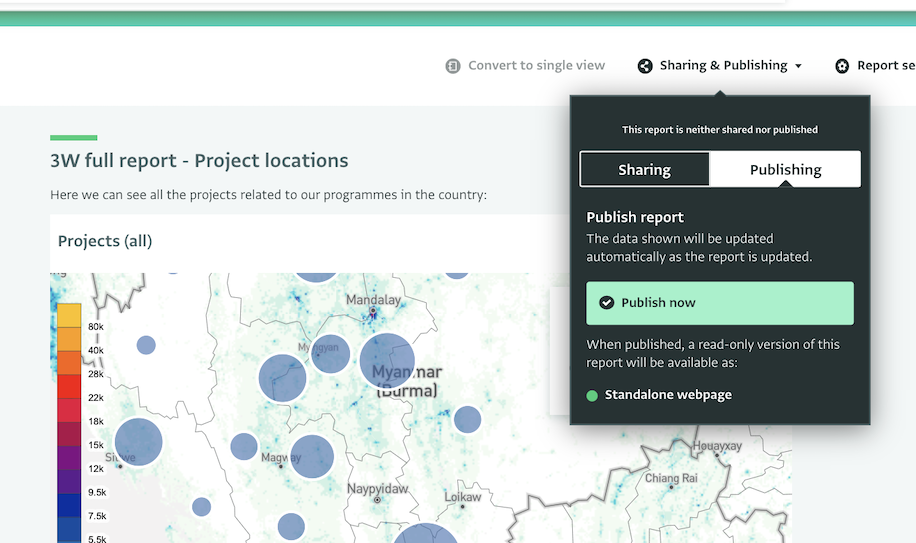
Step 6: Optionally share or publish your Notebook
If you wish you can share the Notebook with other colleagues who have access to ActivityInfo. To be able to view the data displayed in the report, users must have been assigned to the resources (Folders, Forms) that are used in the report.
You can also publish the Notebook as a standalone web page or an embeddable HTML snippet.
Well done!
You have completed the guide ‘Creating a Notebook for 3W Activities’!
Do you wish to create your own database in ActivityInfo? Then, consider taking our online, free self-paced course “Mastering the basics of information management with ActivityInfo” to get started and never hesitate to contact us if you need help.