Analyze, visualize and share results
Analyze and display real-time data in pivot tables, charts and maps. Combine reports in notebooks. Share your progress internally or publish impact reports for the world to see.
- Select your data sources
- Analyze the data
- Share the results
High level or detailed overview of activities
Combine and analyze data to showcase the progress of your results framework or programme activities. All reports are automatically updated when data is updated or added.

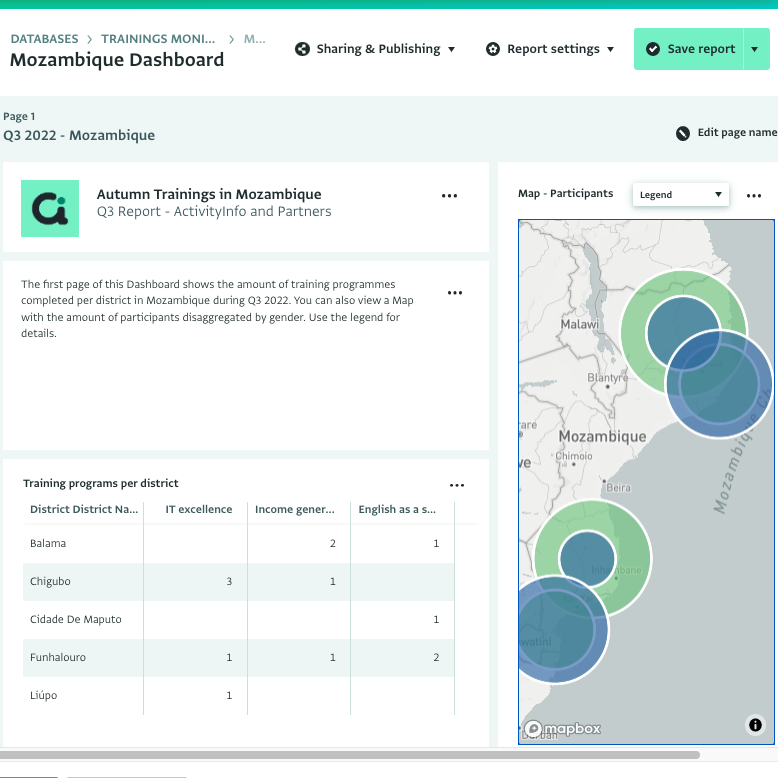
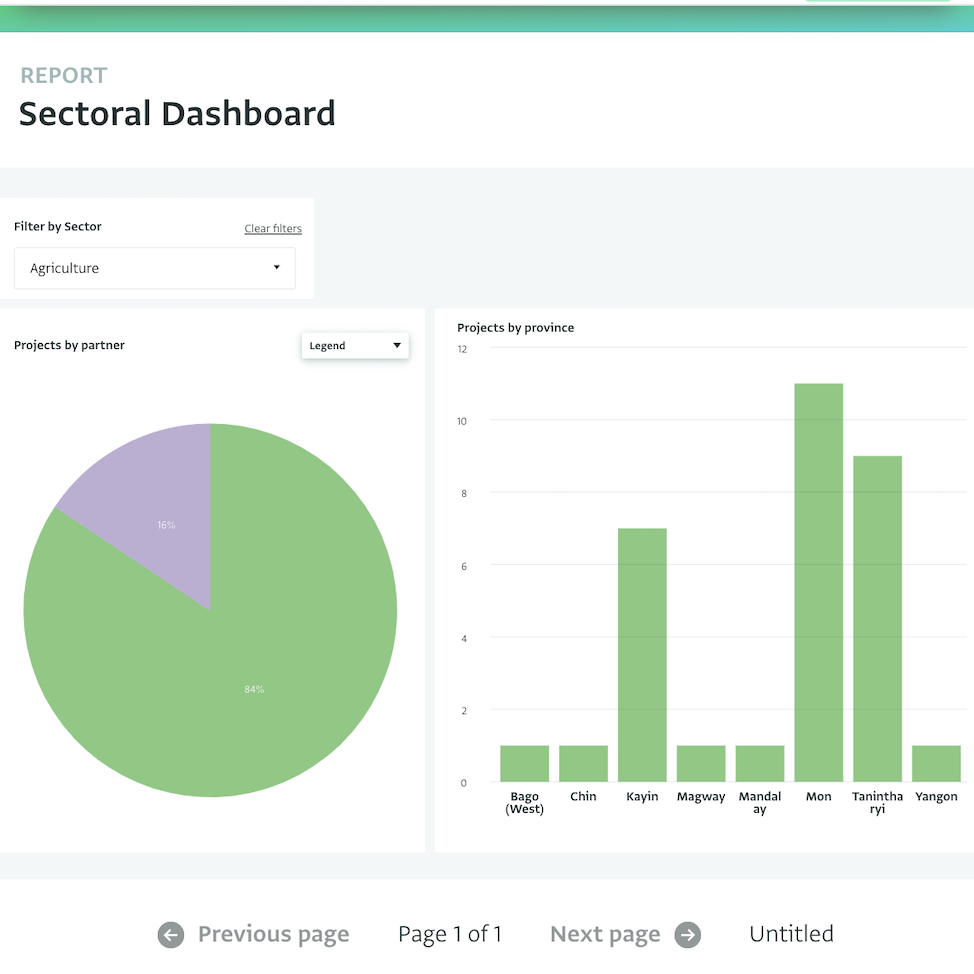
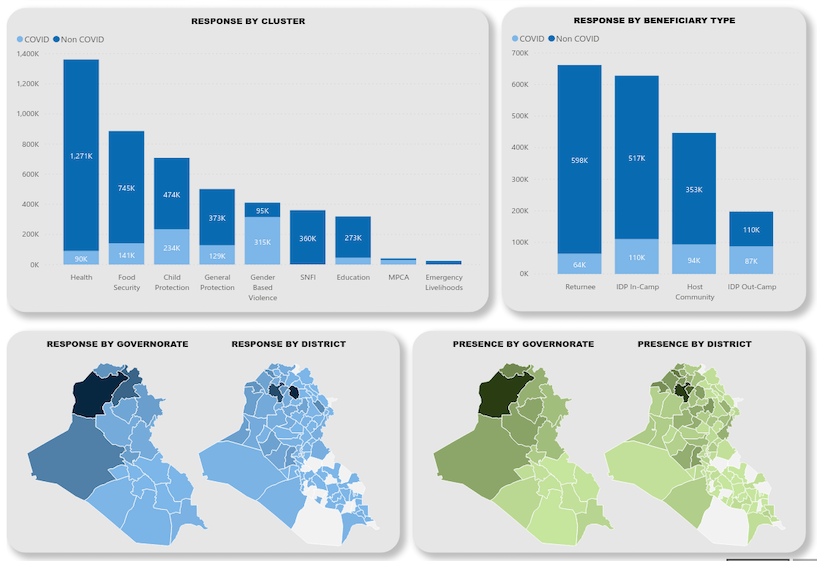
Dashboards
Combine visualizations and tables to get quick insights and support decision-making.
Notebooks
Combine analyses together in comprehensive reports for a complete overview of your progress.
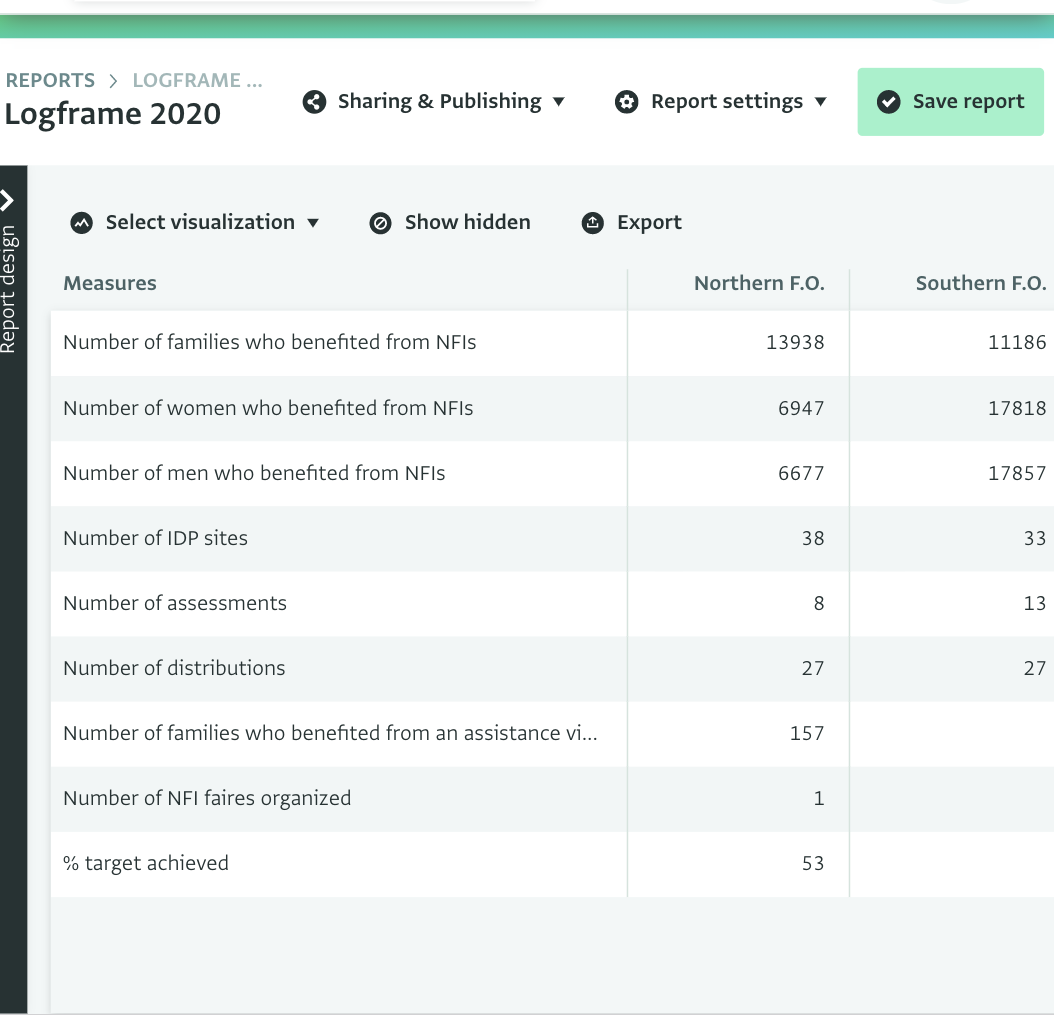
Pivot tables
Use powerful pivot tables for simple or advanced analysis. Analyze data collected in one or multiple forms. Quickly get percentages, totals, blank values. View statistics such as sum, average, count, count distinct, median, mid and max.
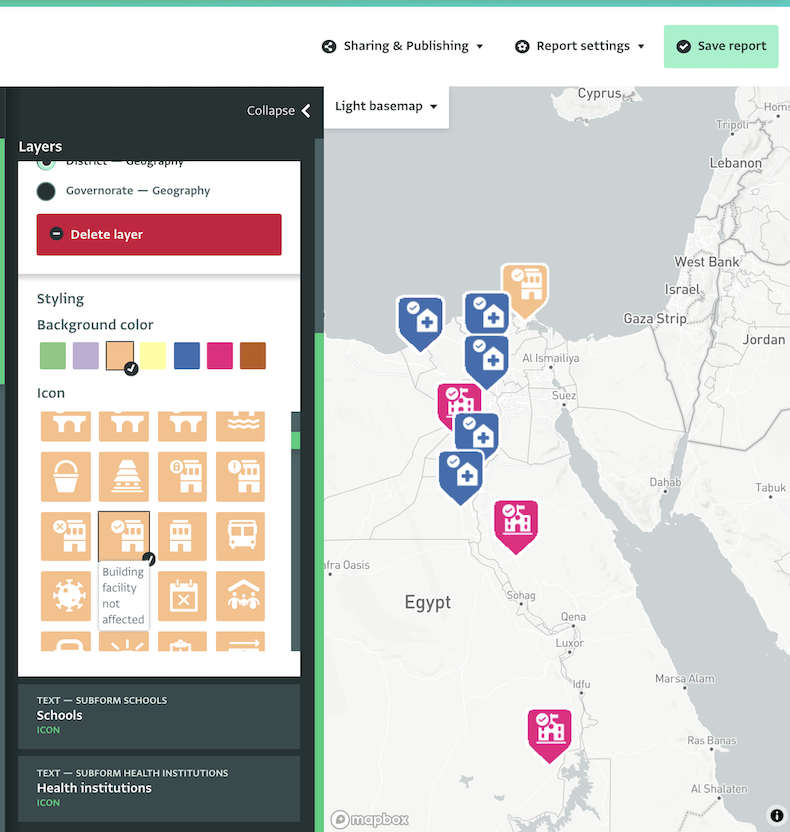
Maps
Map data related to geographical points or connected to the built-in geodatabase in user-friendly maps.
Advanced data analysis
Analyze data further with calculated fields and formulas. Use calculated tables to combine multiple data.
Formula editor
Work comfortably when creating advanced reports, with simple or advanced formulas using the powerful Formula editor.
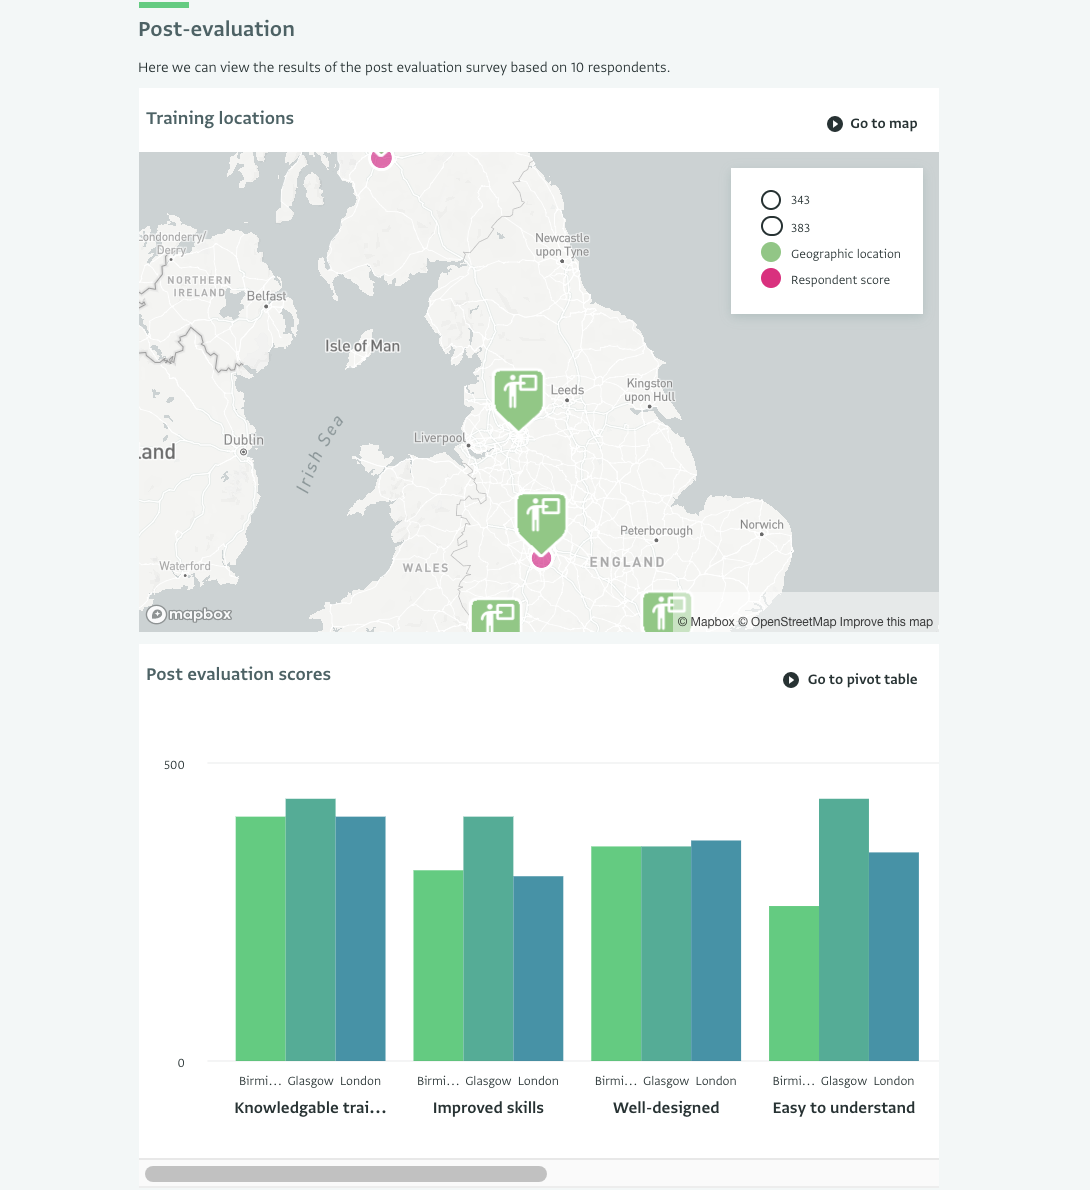
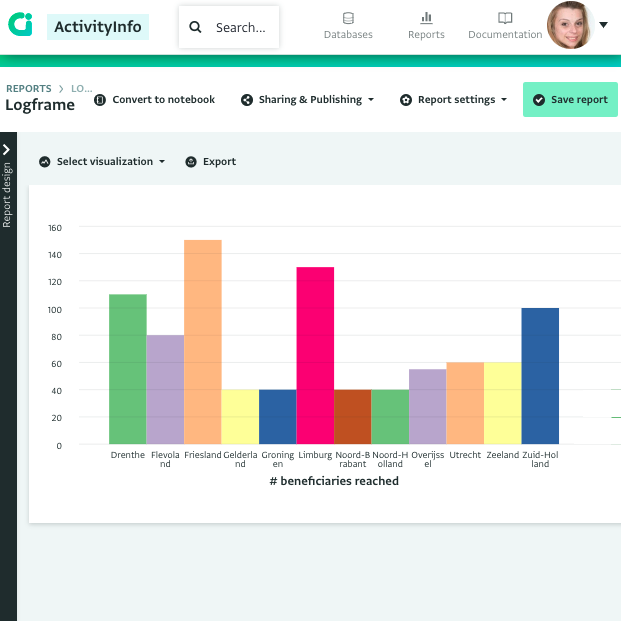
Bar Charts
Visualize data in bar charts. Use different dimensions such as the province, month, partner to get quick insights.
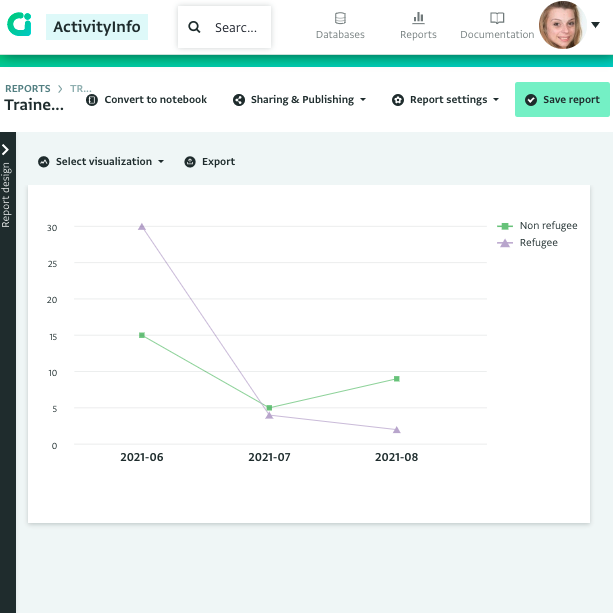
Line Charts
Visualize data in line charts. Explore the progress of your activities through time.
Slicers for interactive dashboards
Use Slicers to drill down on the data and make data exploration easier for everyone.
Publish reports
Publish your reports and make them available to anyone online. Embed reports on your website or get a webpage that anyone can access.
Share reports internally
Add your reports in databases and create a single source of information for your organization. Control who views reports with permissions based on the users’ roles and resource access.
Integrations for more advanced analysis
For a more extensive selection of analysis and visualization options, ActivityInfo can be connected to external software such as Tableau and PowerBI or ArcGIS and QGIS in minutes and without any technical experience.