Language: English
This article describes how to design a report using the Dashboard layout.
A Dashboard is a collection of tables, charts, and maps along with text and section headings combined in a grid.
The Dashboard layout helps you author visualizations that are more compact and dense compared to the Notebook layout.
The difference between a report with a Dashboard layout and a Notebook layout is that the components are laid out in a grid, rather than horizontally. All the functions are the same in both layouts.
The Dashboards you design are visible only to you unless you add them to a Database, share or publish them.
How to add a Report in Dashboard layout
First, create a Report in the Dashboard layout by following these steps:
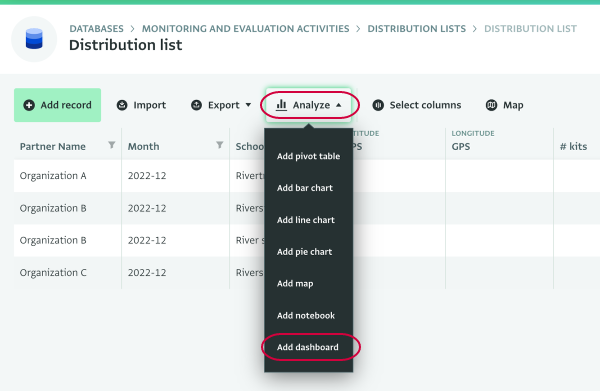
- Navigate to the Table View of the Form you want to base the Dashboard on.
- Click "Analyze" and then select "Add dashboard."
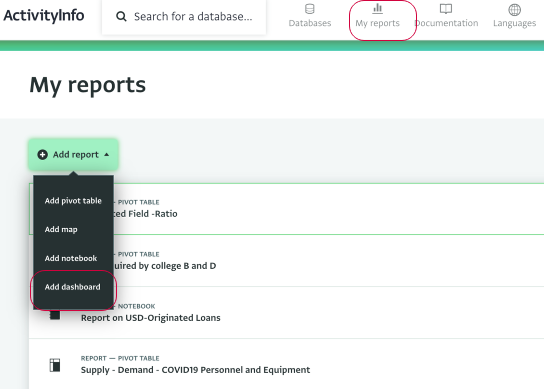
You can add more resources to the Dashboard by following these steps:
- Click on "My reports" to navigate to the Report List page and click on the "Add dashboard" button to navigate to the Report Editor page.
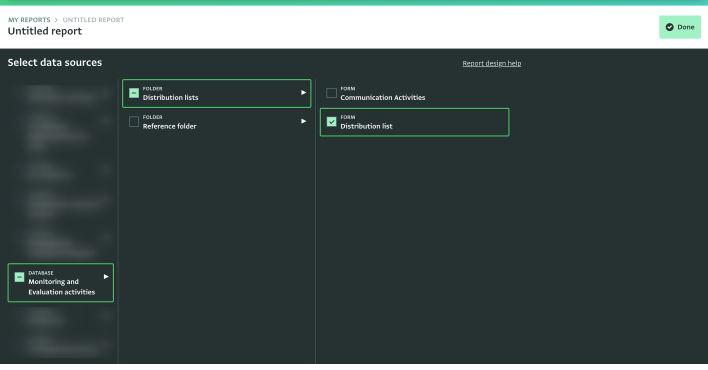
- Select the resource(s) which you want the analyses of the Dashboard to be based on.
The resource(s) can be the content of one or more Databases, one or more Folders or one or more Forms. Depending on what you want to use as your source, you can drill down the list to reach a specific Form or select all the contents available instead.
- To reach a specific Form, click on "Databases" to reveal the list of the available Databases and select the Database(s) that contains the Folder(s) or the Form(s) you want.
- If the Form belongs to a Folder, select the Folder from the list of Folders to reveal the list of Forms in it.
- Alternatively, to use the data of all the Databases, click on the Databases box to select all Databases.
- When you have selected all the sources you need click on the "Done" button.
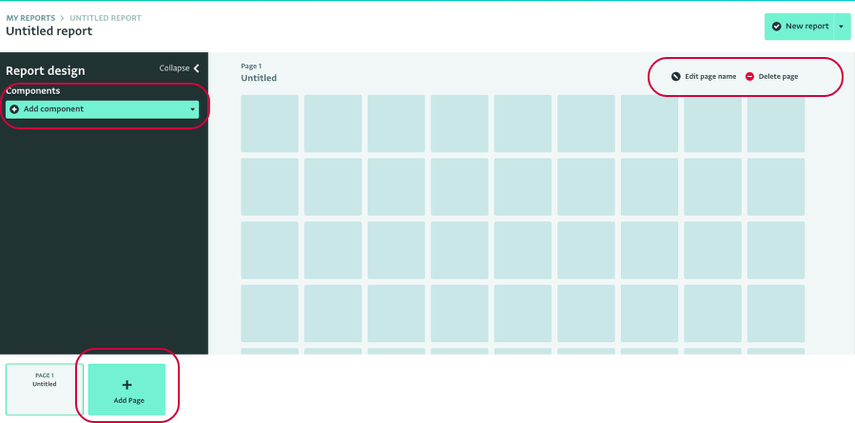
You can perform the following actions on the Dashboard:
- Add another page to the Dashboard by clicking on "Add page".
- Change the name of a specific page by clicking on "Edit page name".
- Delete a page by clicking on "Delete page".
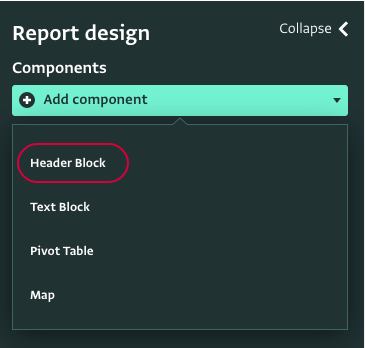
- Reveal the drop-down menu of components and to add the first component to the Dashboard layout by clicking “Add component.”
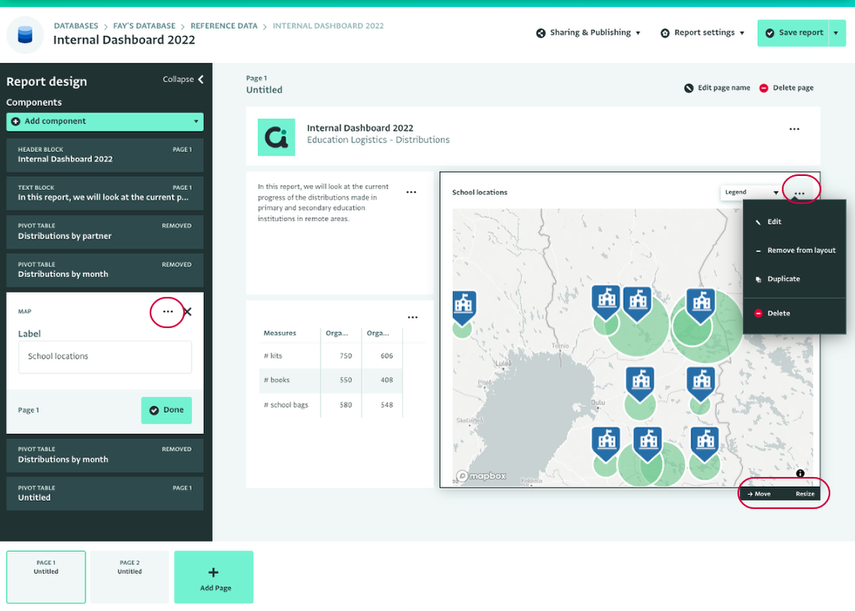
- Resize a block by clicking "Resize" and dragging the block until it reaches the preferred dimensions.
- Move a block by clicking "Move" and dragging the block until it is in the preferred position.
- Click on the three dots "..." at the top corner of a card or block to reveal more options.
Add a Header
To add a Header in the Dashboard layout, follow these steps:
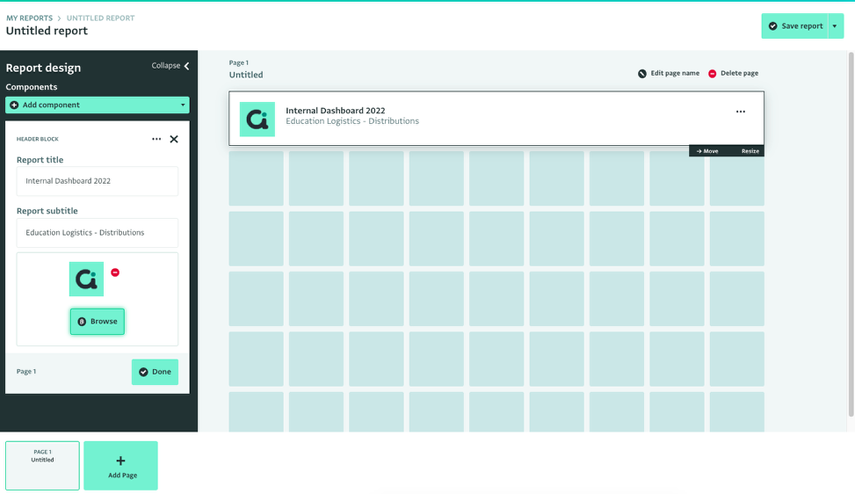
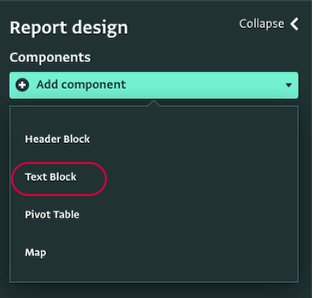
- Click “Add component” and select "Header block."
- Fill out the details of the Header block in the card editor.
- You can optionally add a logo to the Report.
To do so, click "Browse" and upload an image from your files. To remove the upload file click on the "-" icon. - Click on "Done" to close the card.
- Add as many Header blocks as needed.
- The Header block(s) and the information you add appears on the grid.
Add a Text block
To add a Text block in the Dashboard layout, follow these steps:
- Click “Add component” and select "Text block."
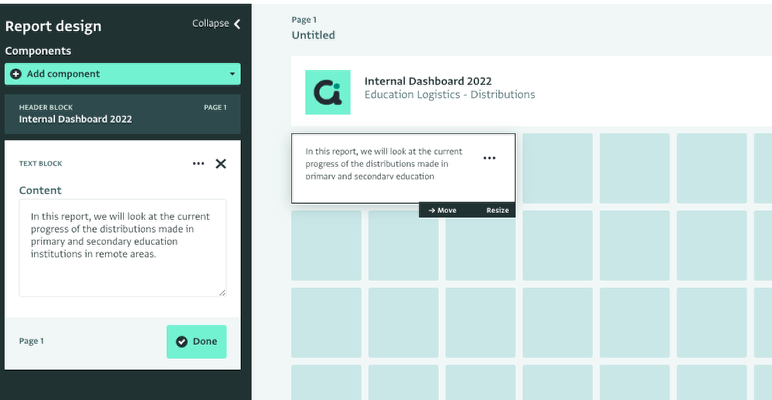
- Type in the content of the Text block in the card editor.
- Click on "Done" to close the card.
- Add as many Text blocks as needed.
- The Text block and the information you add appears on the grid.
- To resize the block click on “Resize” and drag the block until it has the dimensions you prefer.
- To move a the block click on “Move” and drag the block until it is in the position you prefer.
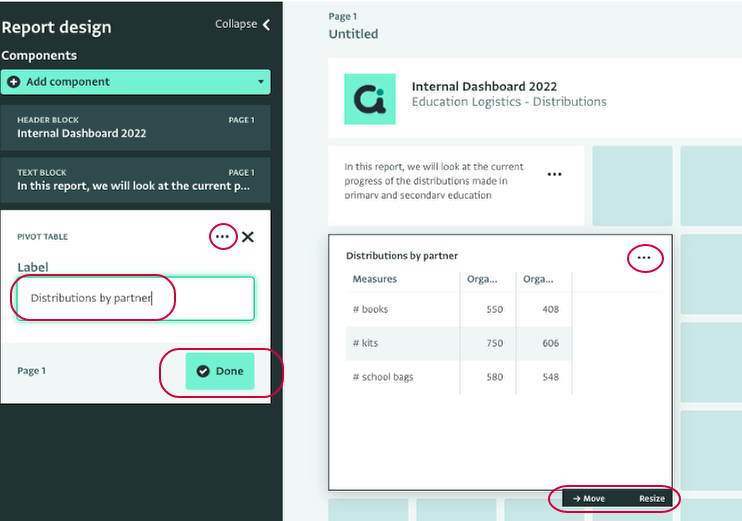
Add a Pivot Table or a Chart visualization
To add a Pivot table or a chart visualization in the Dashboard layout, follow these steps:
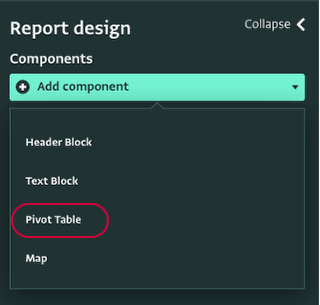
- Click “Add component” and select "Pivot table."
- Drag and drop the Measures and Dimensions you want to use in the Pivot table or chart. For more information, see Designing a Pivot table .
- Click "Done" to add the Pivot table to the grid.
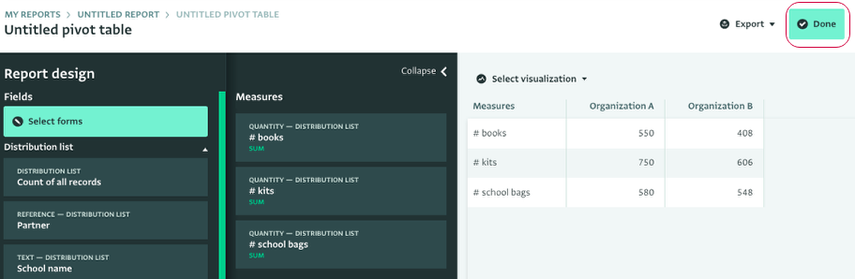
- Add more resources, if necessary, by clicking "Select forms" in the Report Design side panel.
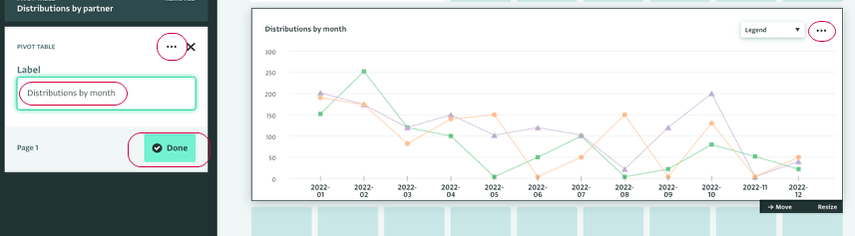
- You can add as many Pivot Table and Chart visualizations as you need.
- Click on the component card to give a name to the newly added Report and click on "Done" to save it.
- To resize the block click on “Resize” and drag the block until it has the dimensions you prefer.
- To move a the block click on “Move” and drag the block until it is in the position you prefer.
- Go back to the Analysis View and continue working on the analysis click on the three dots "..." and click on "Edit."
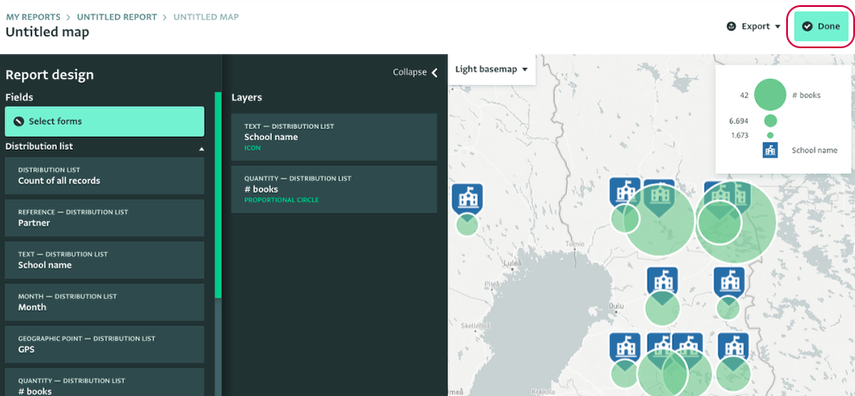
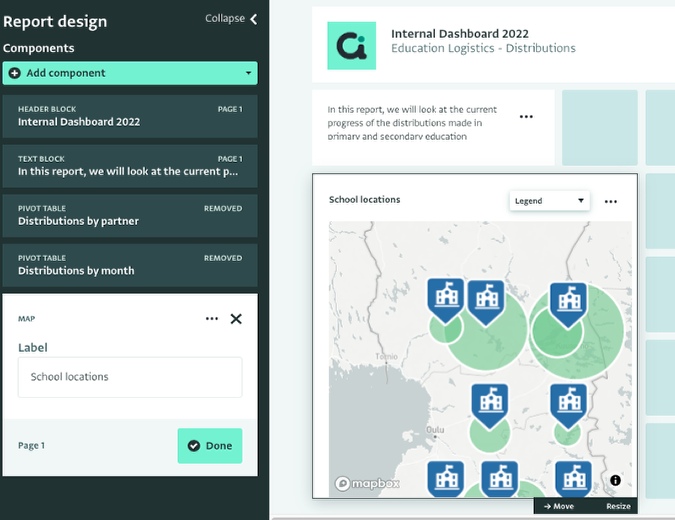
Add a Map visualization
You can collect geographic information using Geographic Point fields to collect specific coordinates or by referencing the built-in geographic Database of ActivityInfo, then visualize the collected information with Maps.
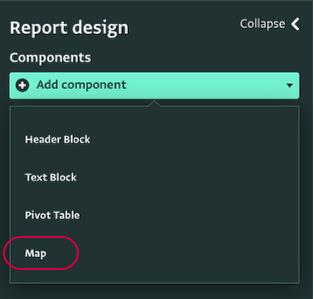
To add a Map in the Dashboard layout, follow these steps:
- Click “Add component” and select "Map."
Note: You can only add a Map if the resources you are using contain Geography sources.
- Design the Map. For more information, see the Designing a Map article.
- Click "Done" to add the Map to the grid.
- Add as many Map visualizations as needed.
- Click on the component card to give a name to the newly added Report and click on "Done" to save it.
- To resize the block click on “Resize” and drag the block until it has the dimensions you prefer.
- To move a the block click on “Move” and drag the block until it is in the position you prefer.
- Go back to the Analysis View and continue working on the analysis click on the three dots "..." and click on "Edit."
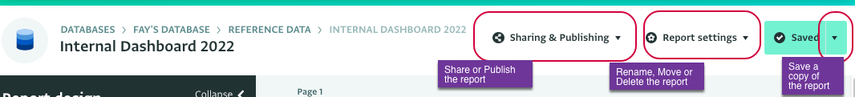
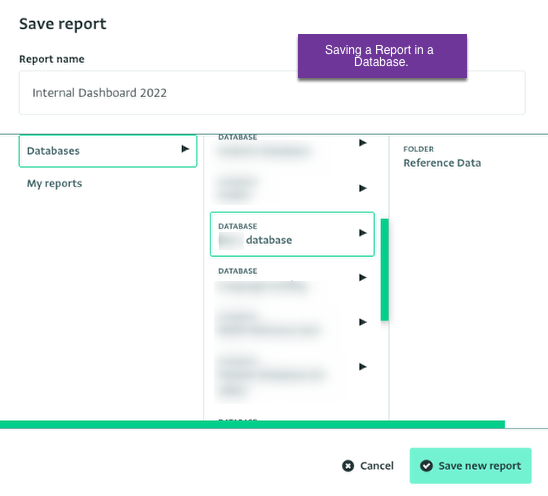
Save, Rename, Share or Publish a Dashboard
When you added all the components you need to the Dashboard, you can name your Dashboard and select where to save it to. You can choose to share the Report, which means publishing it to a Database or Folder; or keep the Report for personal use only.
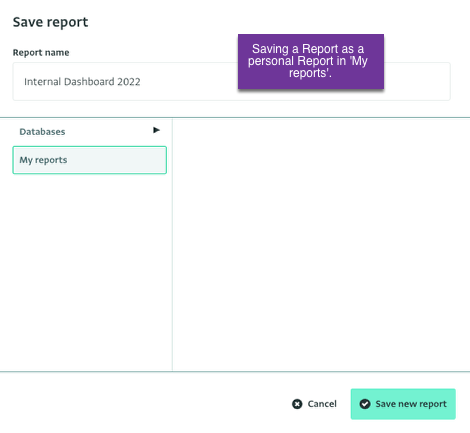
Click "Save report" and pick from the following options:
- To save a Report as a personal report select “My reports” and click on “Save report.” You can choose to publish a personal Report at a later point in time as well.
- To save a Report to a Database or Folder, navigate to the Database and/or folder you want, click on it to select it and click on “Save report.”Once saved, you can view it in the Report List page, if it's saved as a personal report in 'My reports' or in the Database page, or Database Settings page, if it's added to a Database.
Your Report has been saved. You can view it in the Report List page, if it's saved as a personal report in “My reports” or in the Database page or Database Settings page, in case of public Reports.
You can also Rename, Move or Delete a report from "Report settings".
To save a copy of a Report click on the arrow next to the "Saved" button.