Data analysis for everyone
Analyze indicators and show key results with pivot tables. Take decisions based on real-time data.
Showcase how every indicator has been calculated based on primary data.
Conclusions as data comes in
Data displayed on pivot tables is updated as the information comes into the system, so you always get an updated overview of developments.
Instead of keeping indicator definitions trapped in files, make them easily accessible to all relevant stakeholders and collaborate faster and in a more transparent way.
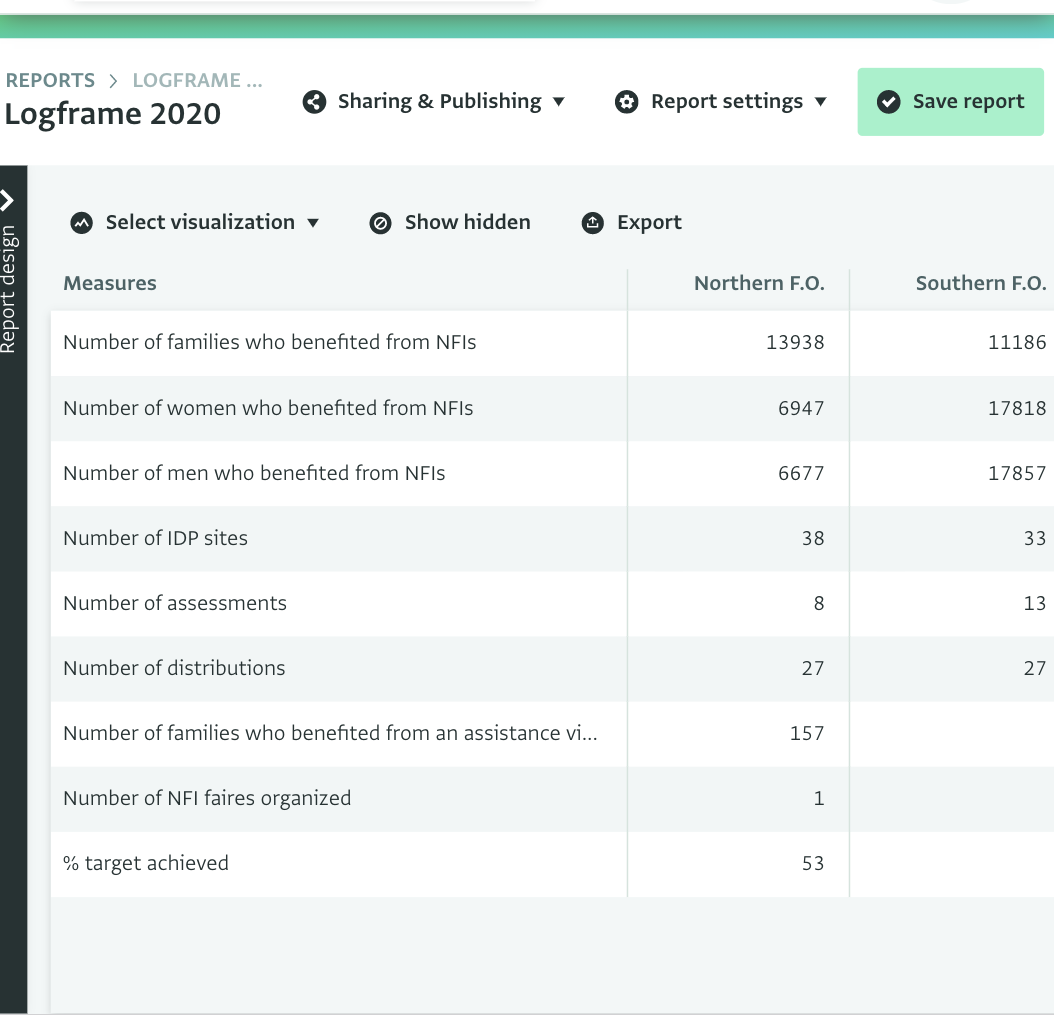
Get exactly the numbers you need
Pivot Tables allow you to summarize and analyze your results by different dimensions such as the province, month, or partner organization. Do further calculations using formulas in the Formula editor and create calculated measures and calculated tables to get more insights on your data.
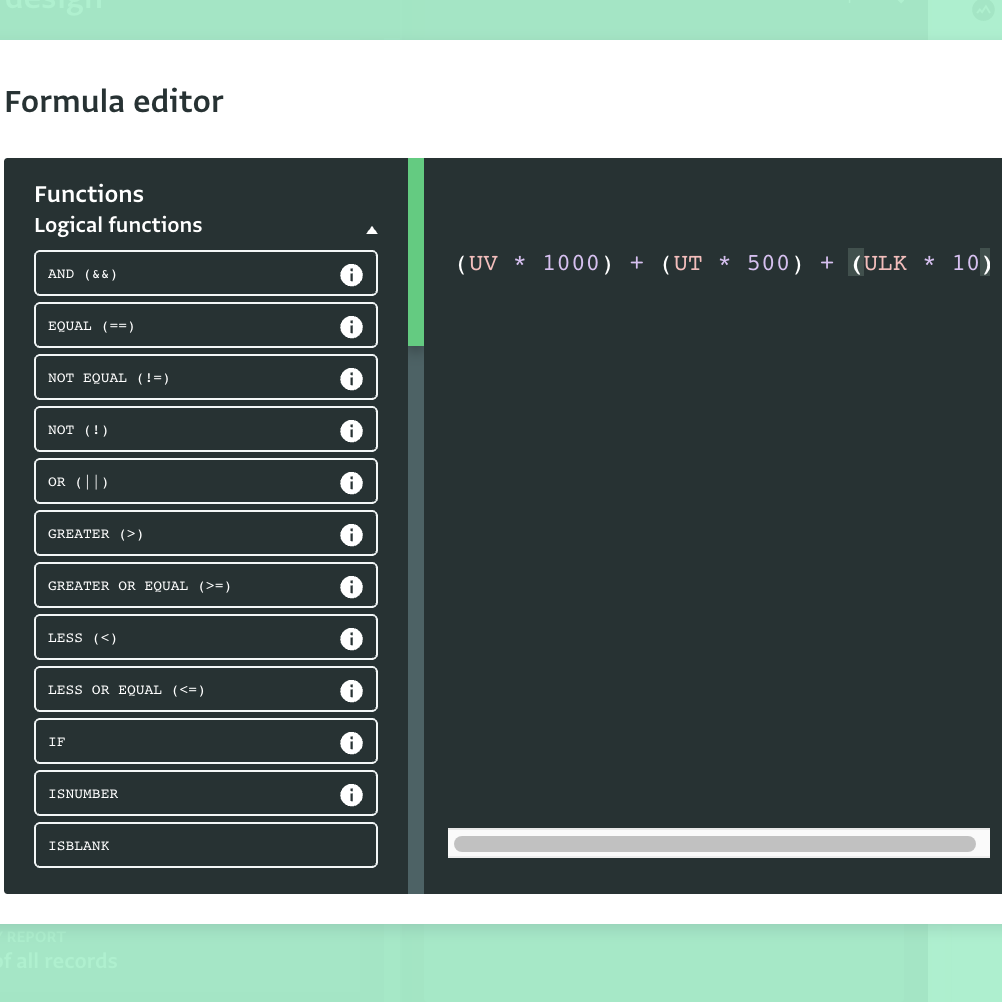
Formula editor
Analyze data comfortably with simple or advanced formulas using a powerful formula editor. Choose from a wide variety of formulas to meet your data analysis needs.
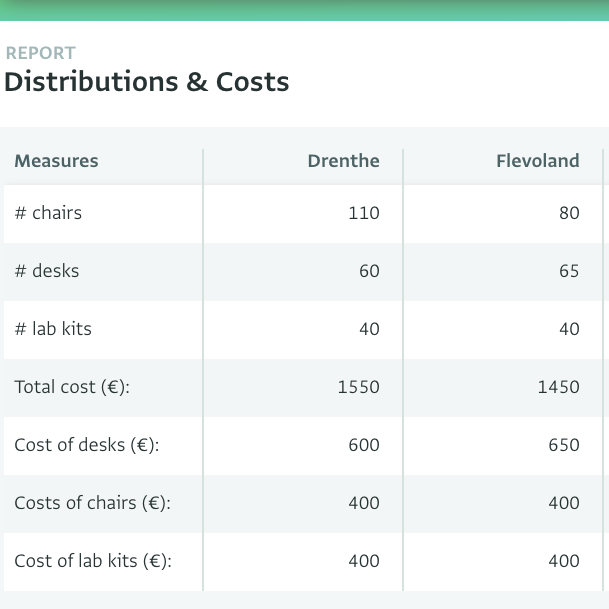
Combine data from various sources
Select various measures from one or more forms and databases and summarize results using your preferred statistic. Use calculated measures and calculated tables for even more advanced analysis.
Share and publish your results
Share your reports with selected users or make your reports available to anyone online and expand the reach of your activities. Embed reports on your website or get a webpage that anyone can access.
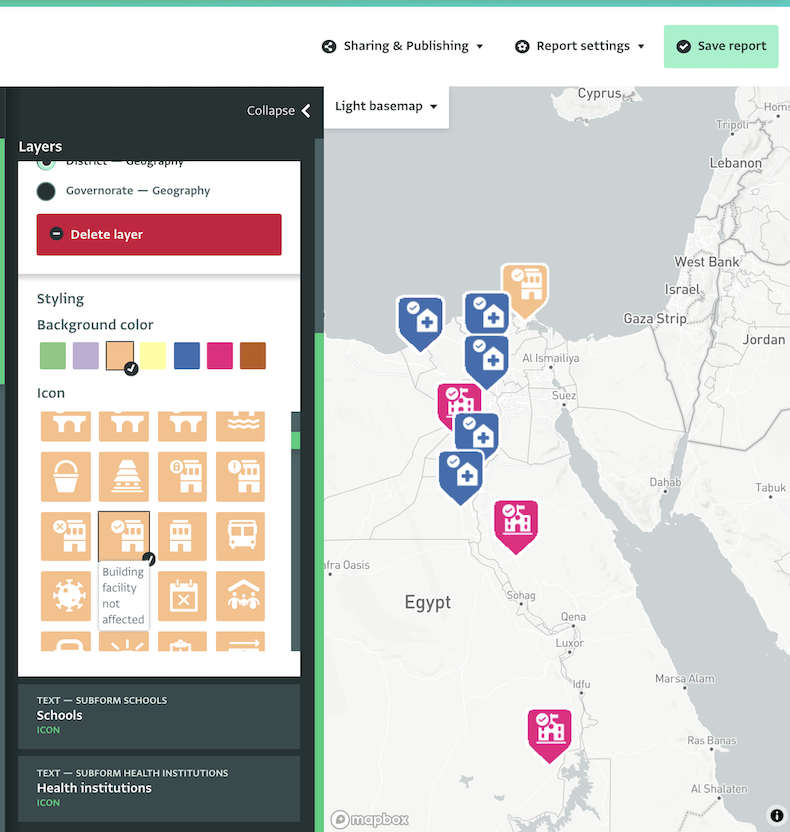
Mapping for everyone
ActivityInfo's powerful mapping tool gives everyone access to the benefits of a sophisticated Geographic Information System, without the need for extensive training.