Language: English
You can use Calculated Tables Combine multiple tables into a single table for analysis.
Secenario
Suppose you have two forms:
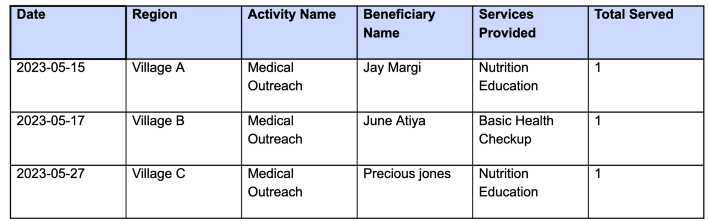
- Medical Outreach Activity
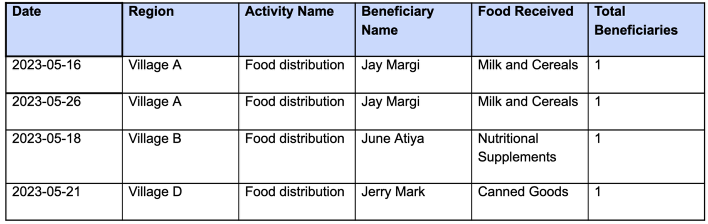
- Food Distribution Activity
And you want to combine both forms in order to transform two tables(forms) into one single table for analysis. Using the UNION function to combine the results of two SELECTCOLUMNS functions, you can create a calculated table that is more convenient for analysis.
- Using a calculated table, you can use the UNION function to combine both tables into a single table .This formula will transform multiple tables into one single table for analysis:
UNION(
SELECTCOLUMNS(cxc6nf3ln7yqo882 ,"Beneficiaries", BName, "Region", Region,"Date",Date,"service type",SP,"Count", TBR,"Activity", AN),
SELECTCOLUMNS(c55so8eln7y90r0a  ,"Beneficiaries", BType, "Region", Region,"Date",Date ,"service type",SP,"Count", TS,"Activity", AN))
Let's break down the formula step by step:
UNION(): This is the outer function that combines the results of twoSELECTCOLUMNSfunctions into a single table. It stacks the rows from bothSELECTCOLUMNSresults on top of each other to create a unified table.SELECTCOLUMNS(): This is a function used to create a new table by selecting specific columns from an existing table. It allows you to reshape the data by choosing which columns to include and giving them new names if desired.cxc6nf3ln7yqo882andc55so8eln7y90r0a: These are references to two different tables (form Id) from which you want to select columns and create a unified table.- "Beneficiaries", "Region", "Date", "service type", "Count", and "Activity": These are the names you've given to the columns you want to select from the source tables. You are essentially renaming the columns in the new table.
- BName, Region, Date, SP, TBR, and AN: These are the actual column values you are selecting from the first source form (cxc6nf3ln7yqo882) and assigning them to the corresponding column names you specified. For example, BName is mapped to "Beneficiaries", Region is mapped to "Region", and so on.
- BType, Region, Date, SP, TS, and AN: These are the actual column values you are selecting from the second source form (c55so8eln7y90r0a) and assigning them to the corresponding column names you specified. Similar to the first SELECTCOLUMNS function, you are renaming the columns here as well.
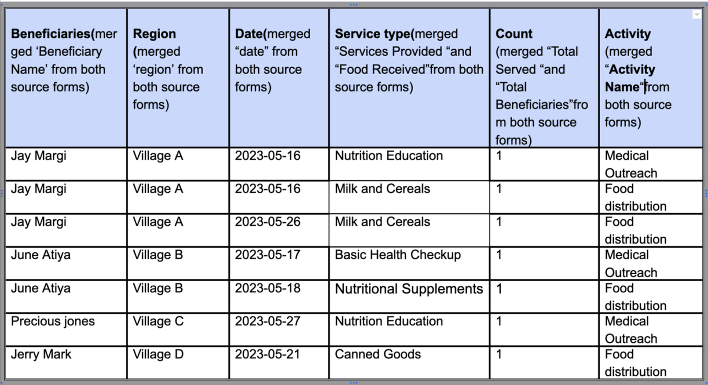
The formula is essentially taking two separate tables, cxc6nf3ln7yqo882 and c55so8eln7y90r0a, and creating a unified table by selecting specific columns from each of them and giving them new names in the new table. The new table will have columns like "Beneficiaries," "Region," "Date," "service type," "Count," and "Activity," containing data from both source forms. This allows you to analyze and compare the data across these columns. The resulting table would look something like this:
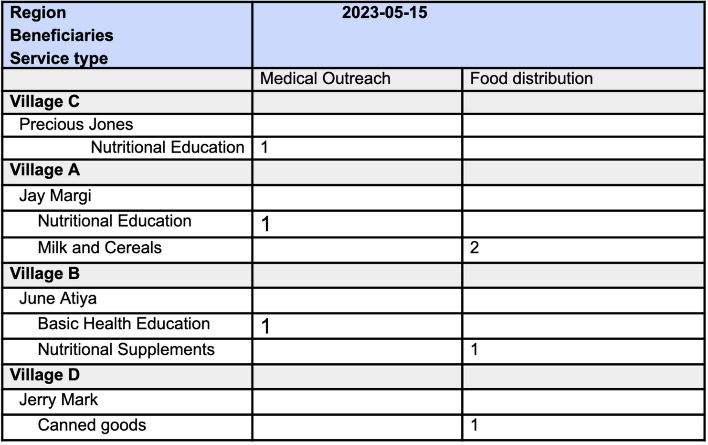
Creating a Pivot Table Report
In your pivot table;
Drag the count to measure
Drag "region", Beneficiaries and "service type" as row dimensions.
Drag "Date" and "Activity" as column dimensions.
You can use Calculated Tables Combine multiple tables into a single table for analysis.
Scenario: Suppose you have two forms;
Medical Outreach Activity
Food Distribution Activity
And you want to combine both forms in order to transform two tables(forms) into one single table for analysis. Using the
UNIONfunction to combine the results of twoSELECTCOLUMNSfunctions, you can create a calculated table that is more convenient for analysis.
- Using a calculated table, you can use the UNION function to combine both tables into a single table .This formula will transform multiple tables into one single table for analysis:
UNION(
SELECTCOLUMNS(cxc6nf3ln7yqo882 ,"Beneficiaries", BName, "Region", Region,"Date",Date,"service type",SP,"Count", TBR,"Activity", AN),
SELECTCOLUMNS(c55so8eln7y90r0a  ,"Beneficiaries", BType, "Region", Region,"Date",Date ,"service type",SP,"Count", TS,"Activity", AN))
Let's break down the formula step by step:
UNION(): This is the outer function that combines the results of twoSELECTCOLUMNSfunctions into a single table. It stacks the rows from bothSELECTCOLUMNSresults on top of each other to create a unified table.SELECTCOLUMNS(): This is a function used to create a new table by selecting specific columns from an existing table. It allows you to reshape the data by choosing which columns to include and giving them new names if desired.cxc6nf3ln7yqo882andc55so8eln7y90r0a: These are references to two different tables (form Id) from which you want to select columns and create a unified table.- "Beneficiaries", "Region", "Date", "service type", "Count", and "Activity": These are the names you've given to the columns you want to select from the source tables. You are essentially renaming the columns in the new table.
- BName, Region, Date, SP, TBR, and AN: These are the actual column values you are selecting from the first source form (cxc6nf3ln7yqo882) and assigning them to the corresponding column names you specified. For example, BName is mapped to "Beneficiaries", Region is mapped to "Region", and so on.
- BType, Region, Date, SP, TS, and AN: These are the actual column values you are selecting from the second source form (c55so8eln7y90r0a) and assigning them to the corresponding column names you specified. Similar to the first SELECTCOLUMNS function, you are renaming the columns here as well.
The formula is essentially taking two separate tables, cxc6nf3ln7yqo882 and c55so8eln7y90r0a, and creating a unified table by selecting specific columns from each of them and giving them new names in the new table. The new table will have columns like "Beneficiaries," "Region," "Date," "service type," "Count," and "Activity," containing data from both source forms. This allows you to analyze and compare the data across these columns. The resulting table would look something like this:
Creating a Pivot Table Report with measures and dimensions from the Calculated Table
In your pivot table;
Drag the count to measure
Drag "region", Beneficiaries and "service type" as row dimensions.
Drag "Date" and "Activity" as column dimensions.