Filters in Pivot tables help analyze the collected data. This article describes the process of adding filters to a Pivot Table.
To add a filter to your Pivot table, follow these steps:
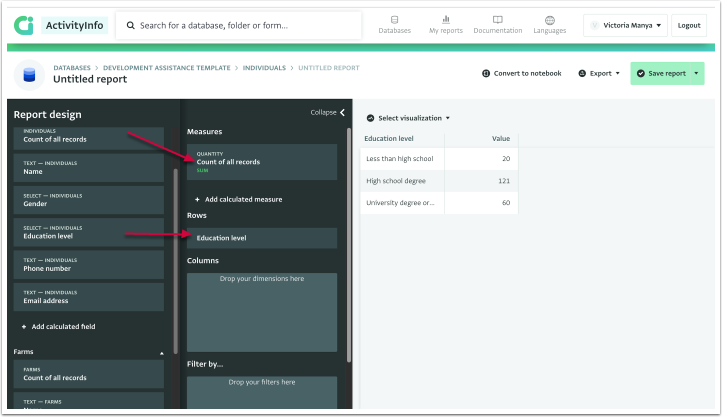
- Add a measure.
In this example, the measure added is the “Count of all records.” - Drag and drop the dimension from field to “Rows”.
In this example, the dimension used is the “Education level” of participants.
- Drag and drop a filter (from the existing fields in your form) to “Filter by” area.
In this example, we have used the gender field as a filter. - Choose the specific category or categories to include in the report.
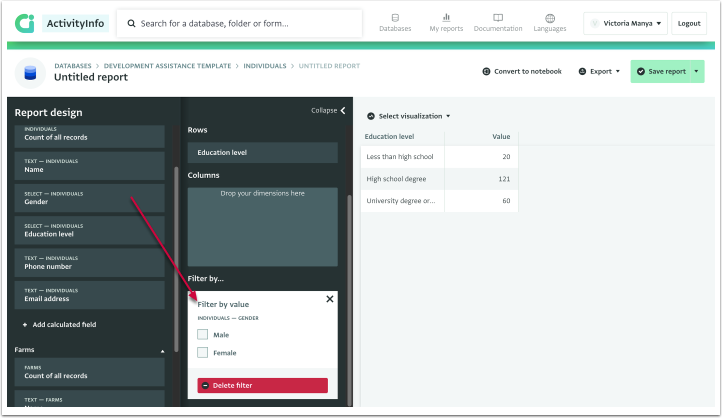
- The filter is added and is ready to be used on the Pivot Table.
- Continue adding filters as needed by dragging additional fields into “Filter by.”
When a corresponding dimension is added, only the rows that match the filter are displayed when using a calculated measure. On the other hand, if a corresponding dimension is not present, the displayed value is adjusted to reflect the applied filter. This ensures that the calculated measure dynamically adapts to the filtering conditions and provides accurate results.
When a corresponding dimension is added, only the rows that match the filter are displayed when using a calculated measure. On the other hand, if a corresponding dimension is not present, the displayed value is adjusted to reflect the applied filter. This ensures that the calculated measure dynamically adapts to the filtering conditions and provides accurate results.
NOTE: At this time, only filtering by discrete categories is supported. We plan on enabling rule-based filtering in a future release.