The following section describes how to create a Pie Chart based on the data you have collected in ActivityInfo. You can select fields from your Forms and Subforms or use other Reports, add Measures and Dimensions and use Statistics to analyse them. Alternatively, you can design a Pivot Table first and visualize it as Pie Chart.
The Pie Charts you design are visible only to you unless you add them to a Database or publish them.
How to visualize data as a Pie Chart
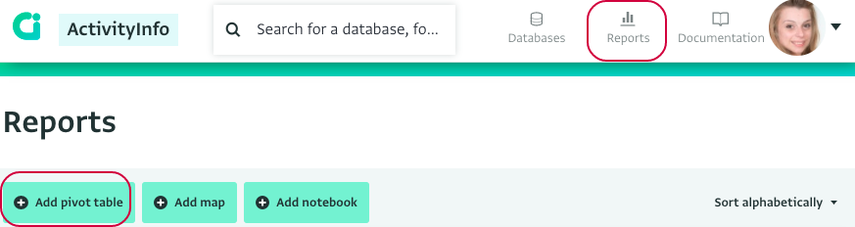
- Click on "My reports" to navigate to the Report List page and click on the "Add pivot table" button to navigate to the Pivot Report page.
- Select the source(s) of the data for the chart and click on the "Done" button. To select all the contents of a Folder tick the box next to its name. To select only specific resources click on the arrow to reveal its contents and check the box that corresponds to the resources you want to use.
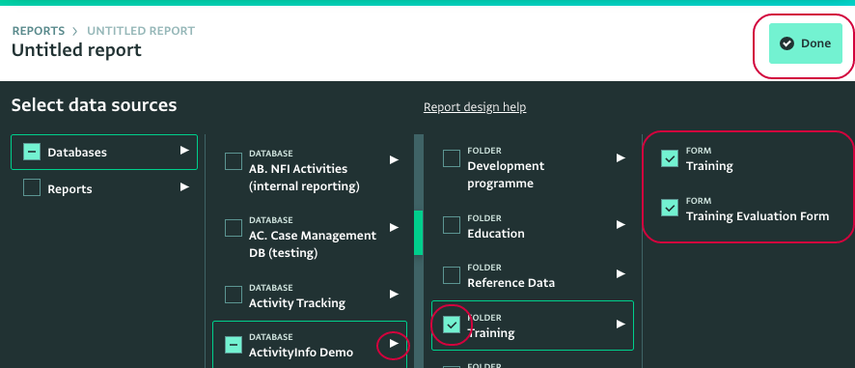
The sources can be one or more Databases, one or more Folders, one or more Forms or other Reports. Depending on what you want to use as your source you can drill down the list to reach a specific Form or select all the contents available instead.
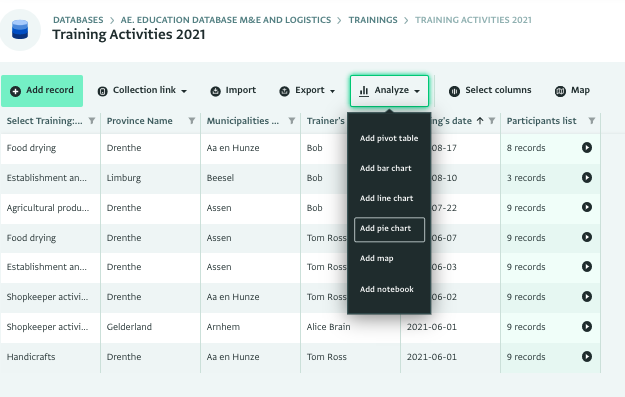
- Alternatively, navigate to the Table View of the Form you want to work with, click on 'Analyze' and then on 'Add pie chart'.
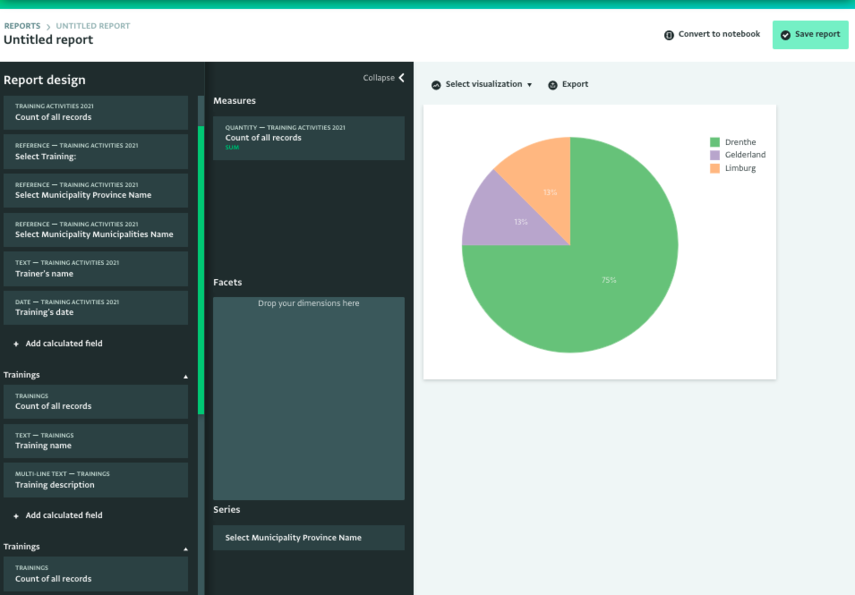
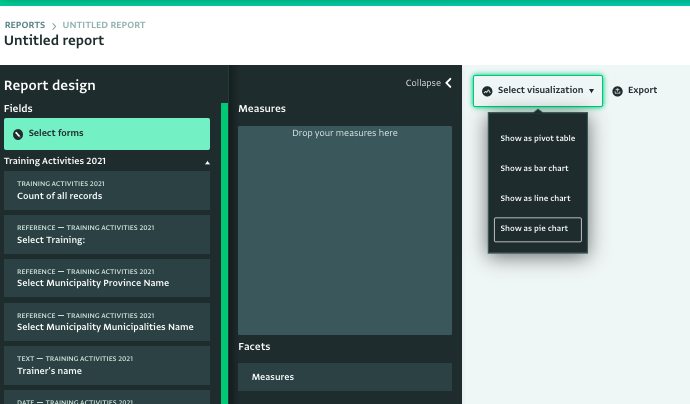
- Click on 'Select visualization' and click on 'Show as pie chart' to select this visualization.
- Then, add a Measure to the Report. This is the actual Data Source for the Pie Chart. You can for example, use the 'Count of all records' of the Parent Form or of a Subform to explore that further.
- Next, add one or more Dimensions, by dragging and dropping fields to the Facets and Series Panel.Click on the "Save" button on the Reports toolbar and provide a Name for your Pie Chart. Then, select whether you want to save the Report as a personal report or add it to a database.
- To save a Report as a personal report select 'My reports' and click on 'Save report'.To save a Report to a Database or Folder, navigate to the Database and/or folder you want, click on it to select it and click on 'Save report'.
- Once your Pie Chart has been saved as Report, you can view it in the Report List page, if it's saved as a personal report in 'My reports' or in the Database page or Database Settings page, if it's added to a Database.