The following section describes how to design a Map based on the data you have collected in ActivityInfo. You can select fields from your Forms and Subforms that include a Geographic Source to display your data on various maps.
When you design a Form that collects geographic information, you can display the data collected in your Records on a Map visualization.
You can collect geographic information using a Geographic Point field to collect specific coordinates or by referencing the built-in geographic Database of ActivityInfo to collect information related to a geographic area. Both are considered Geography Sources.
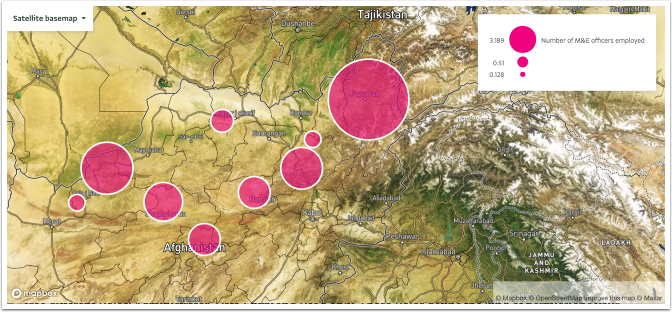
You can display various types of data on a Map. Quantity and Calculated fields showing numerical values will be displayed as proportional circles by default. Other types of fields and Calculated fields that return text or boolean values will be displayed as icons by default.
You can choose to display the data in different types of basemaps such as:
- Light
- Street
- Satellite
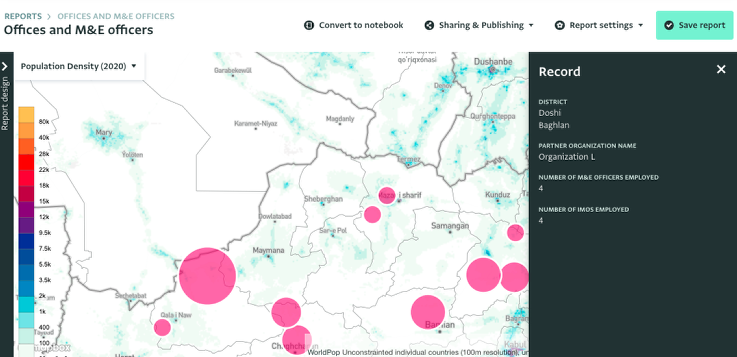
- Population density (2020)
If you don't collect geographic information you won't be able to design a Map. Records that have no values will not be displayed on the Map.
Learn everything you need about thematic maps in our Webinar "Creating thematic maps with ActivityInfo".
Once you are familiar with Maps, master the feature by completing the guide "Using maps to plan interventions".
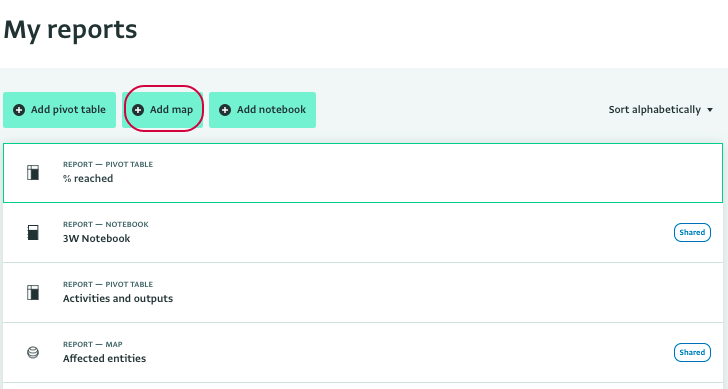
Navigate to the Map Report page
- Click on "My reports" to navigate to the Report List page.
- Click on the "Add map" button to navigate to the Map Report page.
Select the sources of the data for the Map
- During the first phase of the Map design, you must select the source(s) of the data you will use. These can be the content of one or more Databases, one or more Folders, one or more Forms. Depending on what you want to use as your source you can drill down the list to reach a specific Form or select all the contents available instead.
- To reach a specific Form, click on a Database to reveal the list of the available Forms and Folders.
- If the Form belongs to a Folder, select the Folder from the list of Folders to reveal the list of Forms in it.
- When you have selected all the sources you need click on the "Done" button.
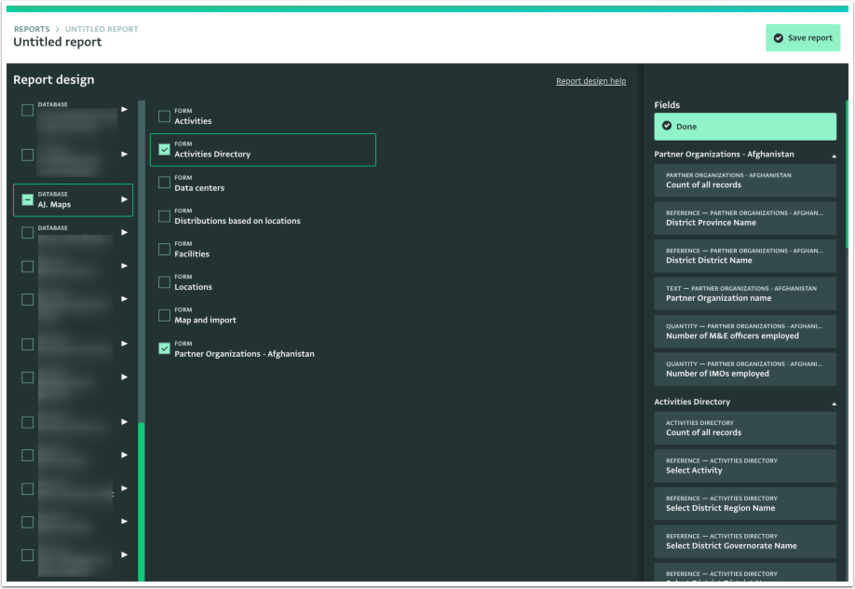
Make sure that you use Forms that collect geographic information.
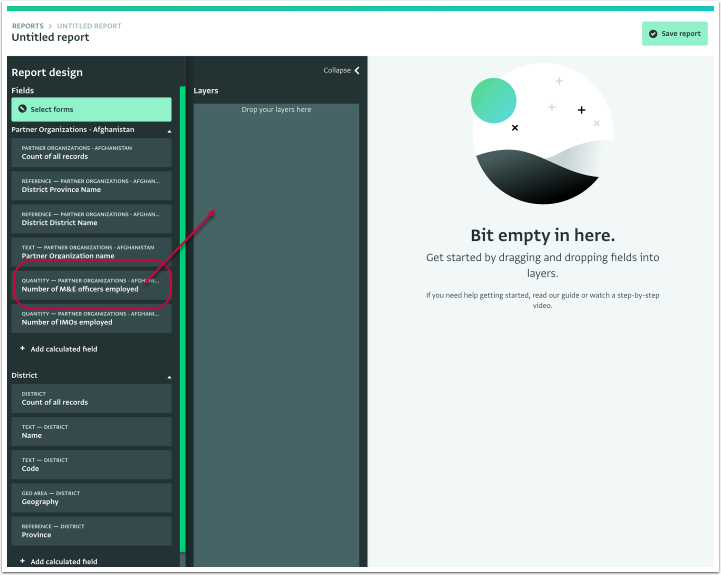
Add Layers
- To design a Map you first need to add Layers. Select the data you want to display on the map and drag and drop it in the Layers panel.
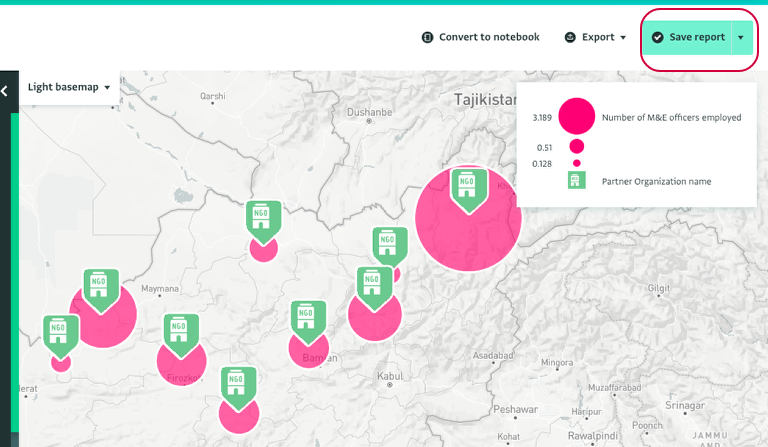
- Once you drop a data source on the Layers panel, observe how the Map starts forming.
- Zoom in and out of the map using your mouse scroll wheel. Customize the way the map appears by clicking on the right mouse button and moving the cursor right or left at the same time.
- Change the Map to a different basemap by selecting the type of basemap you prefer in the Basemap menu.
- Click on 'Collapse' to collapse the Report Design side panel.
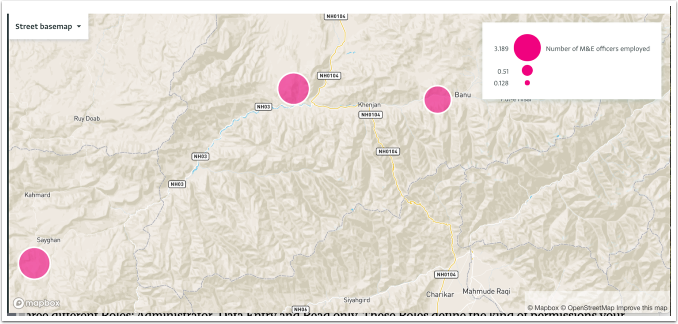
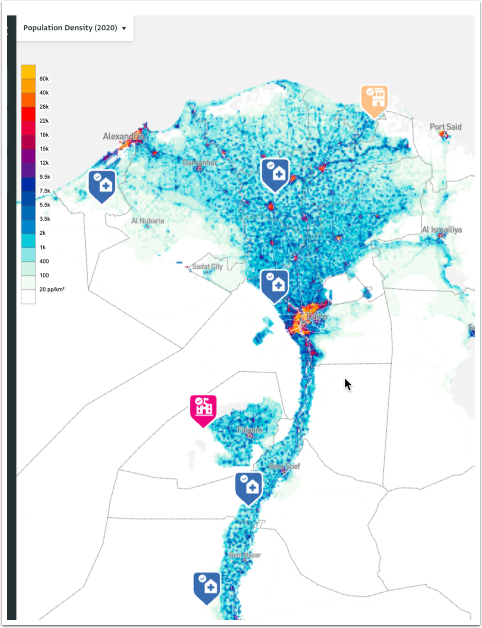
- Click on a point on the map to show the details of the Record(s) displayed.
You can add as many Layers as needed by dragging and dropping the data sources on the panel.
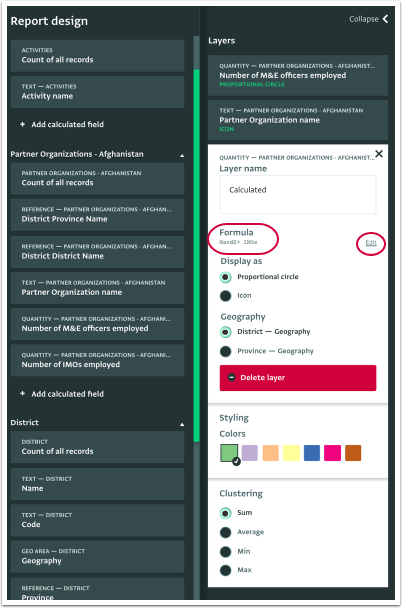
- Click on the Layer card to reveal more options.
- Change the name of the Layer by typing a new name in the Layer card.
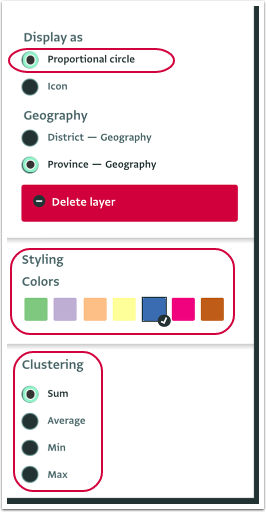
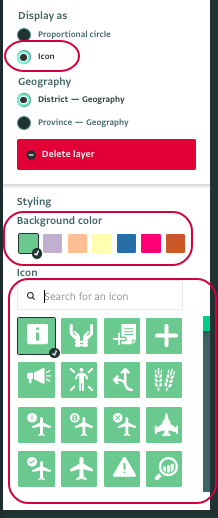
- Select the display you prefer.
- Select the geography source.
Delete a Layer by clicking on "Delete layer".
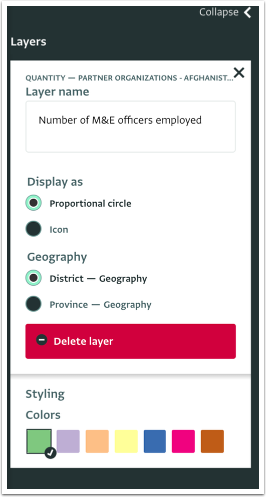
- You can further define the style of the Layer.
- When using proportional circles you can select the color of the circles by clicking on a color and the type of clustering you prefer to show on the map (Sum, Average, Min or Max value).
- When using icons you can select the icon to use and the color of the icon by clicking on the icon and the color respectively.
- Search for a specific icon using the Search Bar.
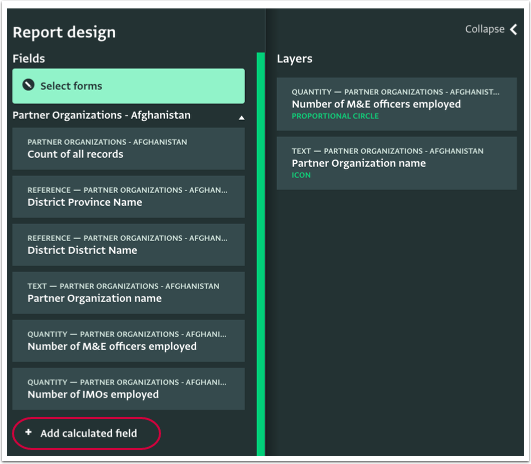
Add a Calculated field as a Layer (optionally)
- You can optionally add a Calculated field to your Map. Calculated fields allow you to analyze the data and display the results on the Map. Click on "+ Add calculated field" to navigate to the Formula editor.
Calculated fields showing numerical values will be displayed as proportional circles by default. Calculated fields that return text or boolean values will be displayed as icons by default.
- The Formula editor will appear. Under 'Functions' (left-hand side) you can view the functions available. Under 'Fields' (right-hand side) you can view the fields available.
- Start writing your Formula and click on "Done" when the Formula is ready.
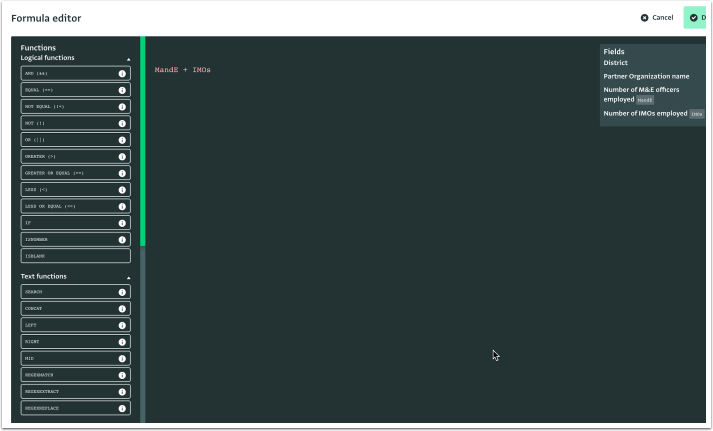
If the Formula is valid then the done button will be enabled. Otherwise, it will remain disabled.
View the available functions in the Formulas manual and read more about writing formulas.
You can give a name to the Layer of the Calculated field and define the display, geography, styling and clustering options in the same way you did with the rest of the Layers.
To edit the Formula, click on "Edit" in the Formula section of the Layer card.
Name and Save the Map
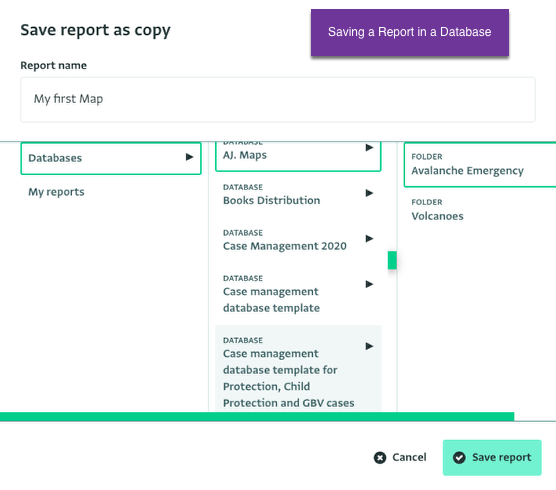
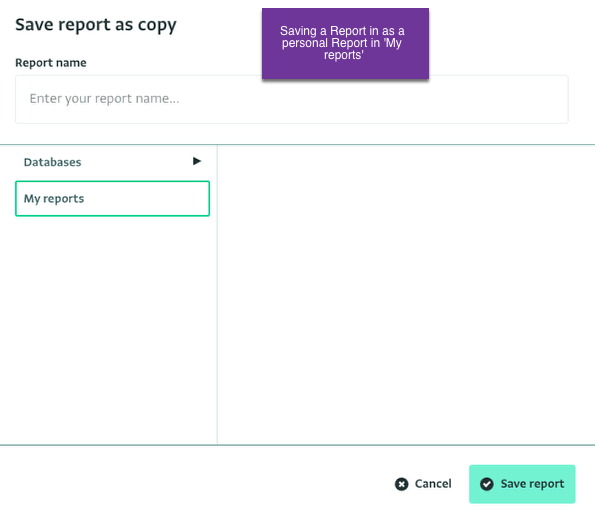
Once you are happy with the result, click on "Save report" to save the Map.
To save a Report as a personal report select 'My reports' and click on 'Save report'. To save a Report to a Database or Folder, navigate to the Database and/or folder you want, click on it to select it and click on 'Save report'.
Once your Report has been saved as Report, you can view it in the Report List page, if it's saved as a personal report in 'My reports' or in the Database page or Database Settings page, if it's added to a Database.
You can also Publish a Report.