Using maps to plan interventions
In the past, we discussed how we can visualize our data in map reports. In this article, we will explore how you can use ActivityInfo and maps to assess sites and plan an intervention before going out in the field.
Such an exercise can provide you with insights about the situation in the field. For example, you can investigate whether a site can be easily accessed thanks to existing infrastructure using a Street and a Satellite basemap. You can check if it is located in an urban area or in a less densely populated location using a Population Density Map. You can also explore the surroundings and get some initial information about the resources or networks available in the area. With this kind of information you can assess each site and plan activities that are tailored to the needs of each specific site. For instance, you can decide to run a cash-based intervention with vouchers in a site where there is a market available whereas you might prefer to do an NFI and Food Distribution intervention in a more secluded area.
In our example, we will use a form with IDP sites which you can also access (source: “International Organization for Migration (IOM), Displacement Tracking Matrix (DTM)”).
We will display the sites using the Map View and the Street, Satellite, and Population Density (2020) baseline maps. You can use the same form or your own forms but please keep in mind that the forms must include either a Geographic Point field or a Reference field referencing the geodatabase and the specific administrative level you want to show on the map. To be able to explore in detail the site settings, it is more useful to collect specific geographic coordinates using a Geographic Point field.
Apart from the Map View, you can also use Map Reports in ActivityInfo. These allow you to combine data from multiple forms and to bring in more information related to each record.
Step 1: Collect the sites’ coordinates
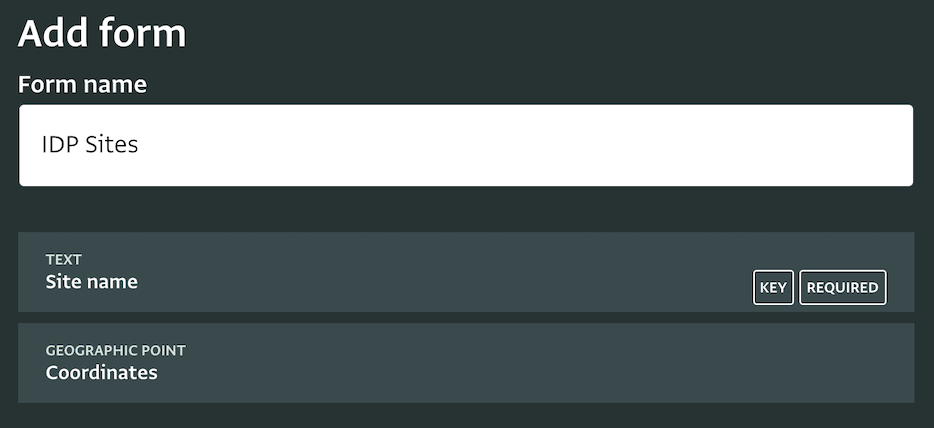
To be able to map a list of sites on a map in ActivityInfo you need to design a Form which will collect these sites as records. You can use a Text field to collect the name of the site and a Geographic Point field to collect the coordinates of each site. You can make the Text field a Key field to ensure there will be no duplicate records for every site.
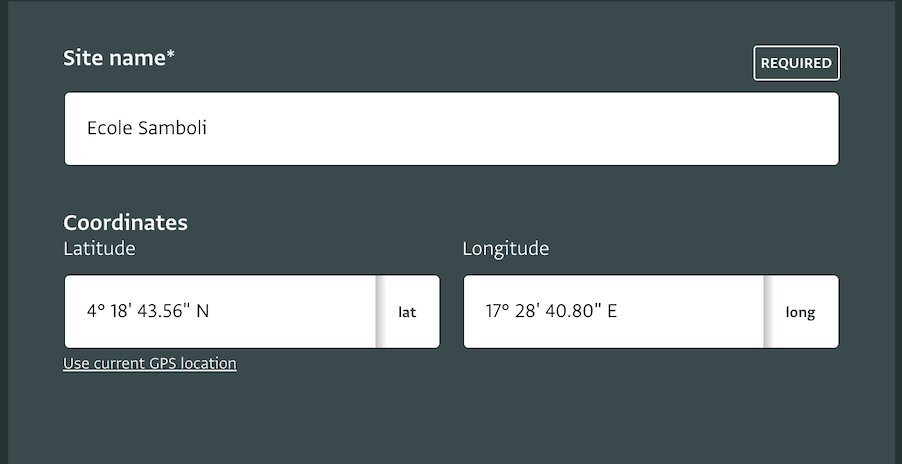
Then, you can add as records all the available sites. Alternatively, you can import them. Please keep in mind that coordinates of latitude must specify a hemisphere (using +/-/ or N/S) and coordinates of longitude must specify a hemisphere (using +/-/ or E/W). So for example, 52° 3' 38.35" N or -67.62 are accepted formats but 39,074,200 is not an accepted format.
To import the sites as records, make sure that each column of your spreadsheet has a header that matches a label in the form. Note that when importing Geographic Point fields you need to enter both a Latitude and a Longitude column in the spreadsheet. You need to add valid coordinates for both columns and to make sure that the format of the number is correct.
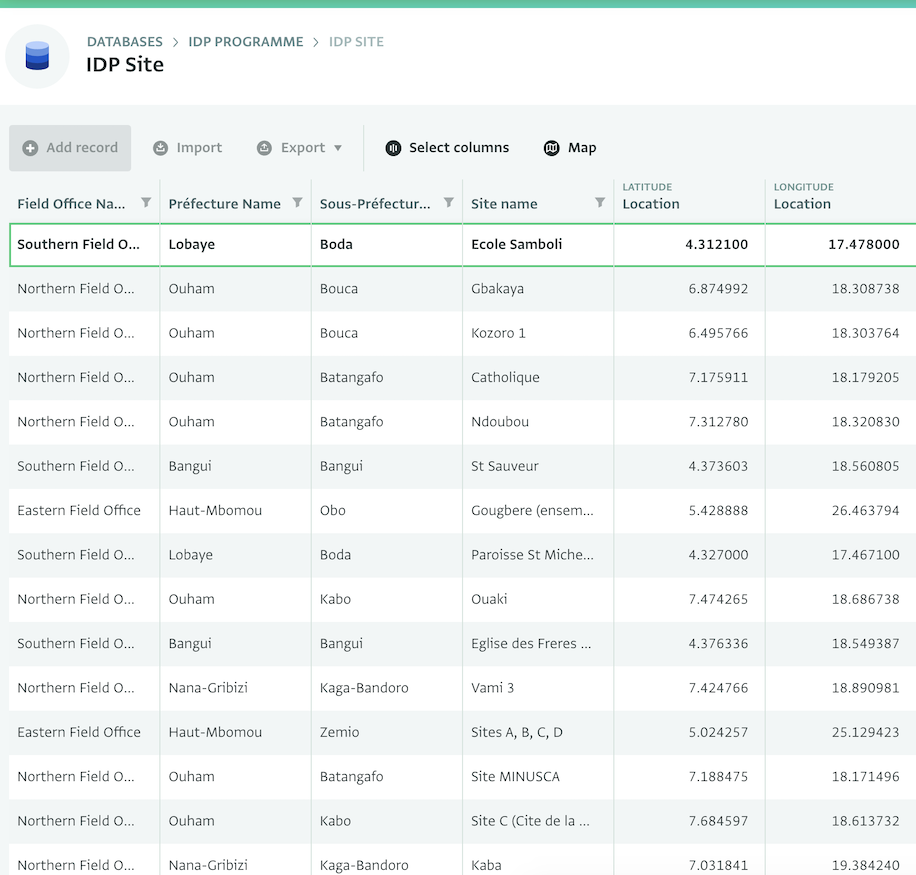
You can also collect more information related to the site such as the field office responsible for that site, the Prefecture or other Administrative levels related to the site, and other information you might have on the site. Take a look at the Table View of this form for more inspiration.
Step 2: Map the sites
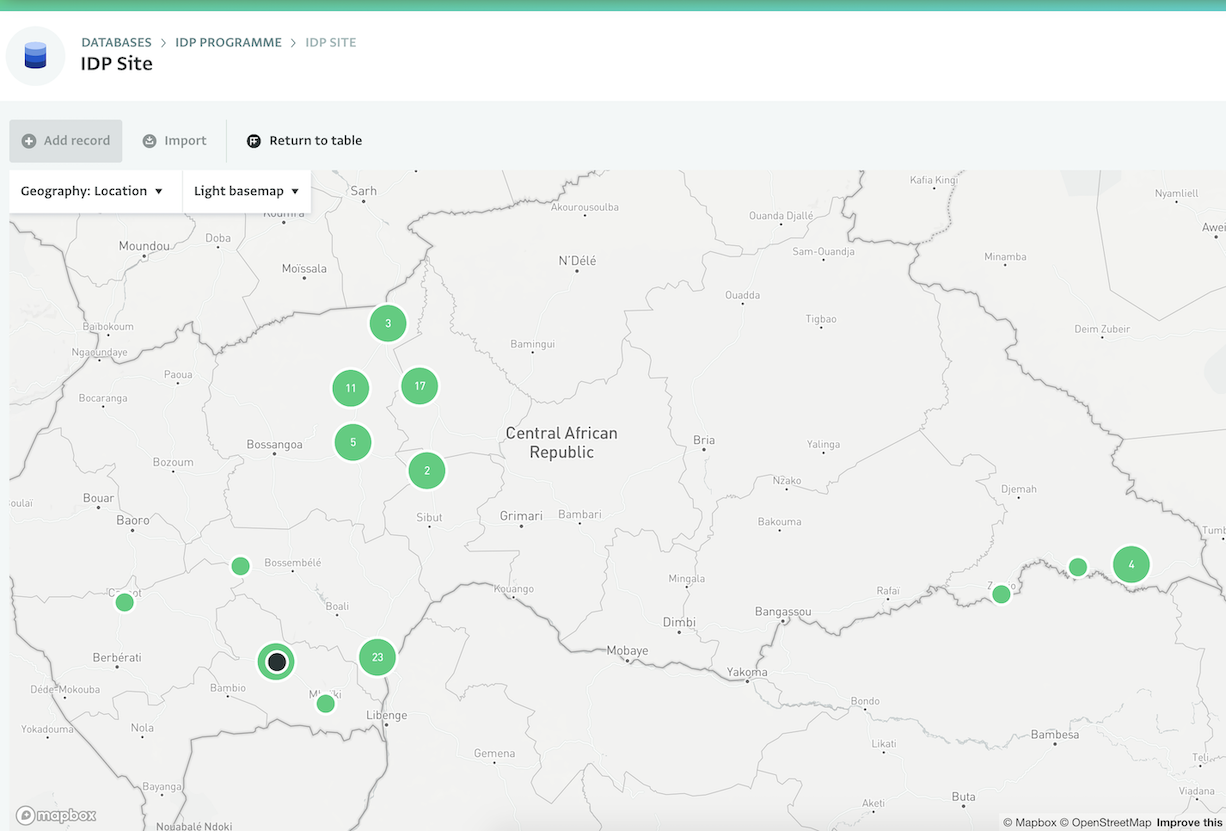
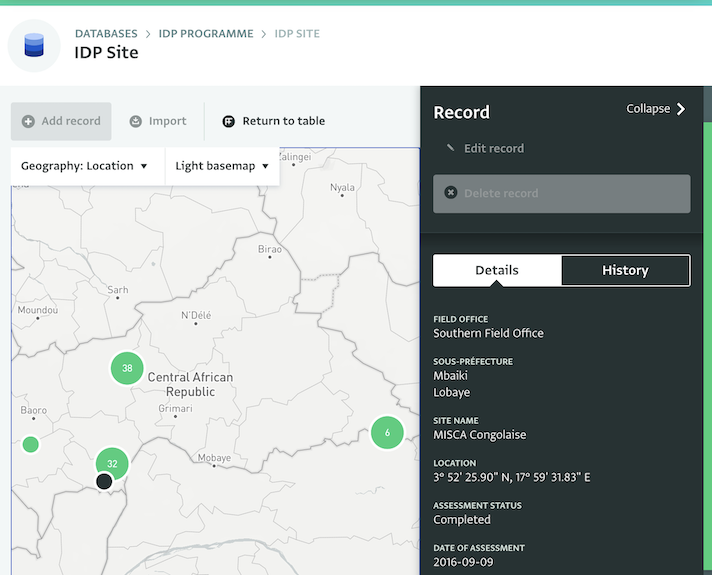
You have added all the sites and their coordinates as records to the form you designed. Now you can easily display them on a Map View by clicking on the Map button in the Table View interface.
You can click on a site to reveal the information collected in the record about it in the side panel.
Step 3: Explore the sites for your interventions
Now that you have all the sites available on a map you can start the initial assessment. Select a site to start with and zoom in the map using the mouse wheel. The default basemap is the Light basemap.
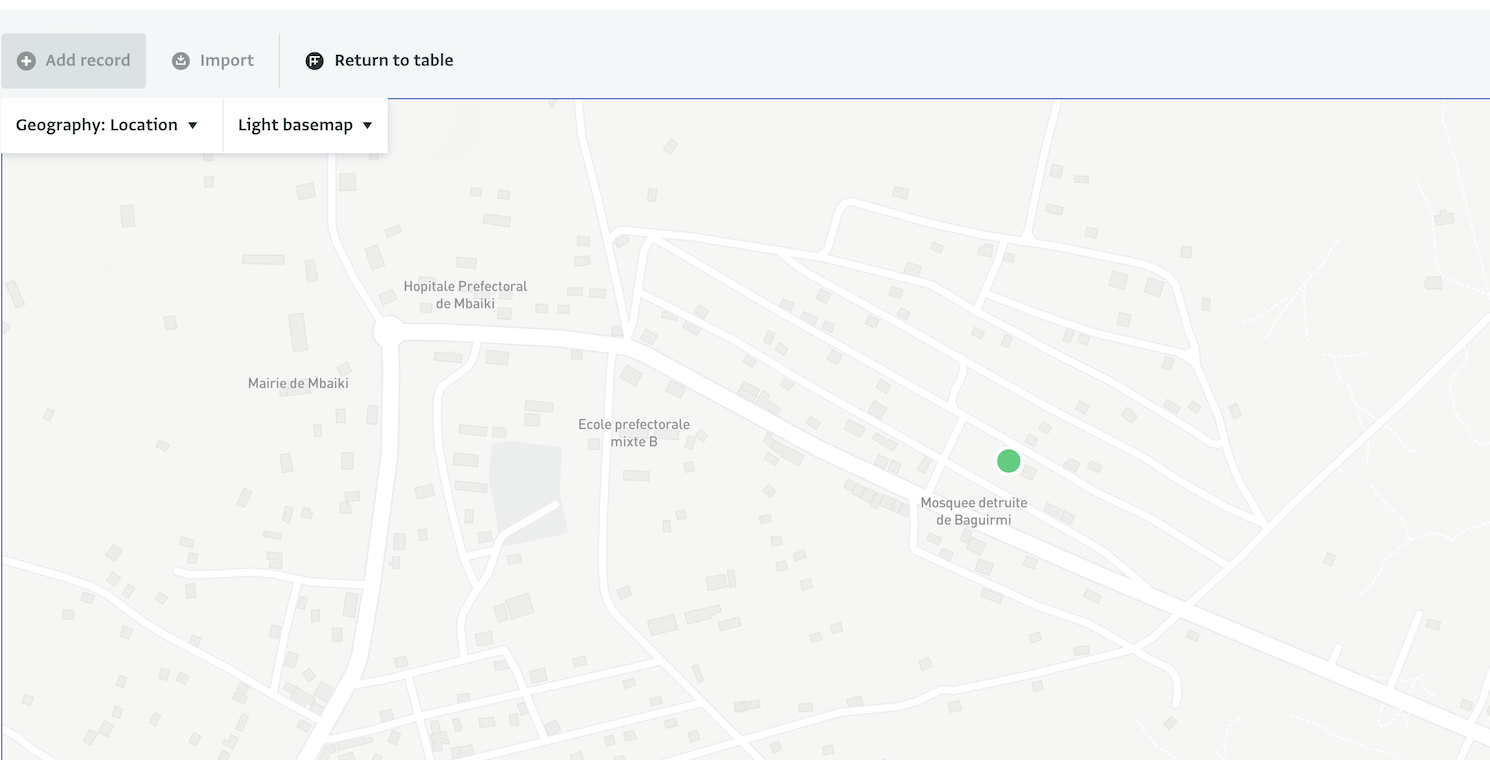
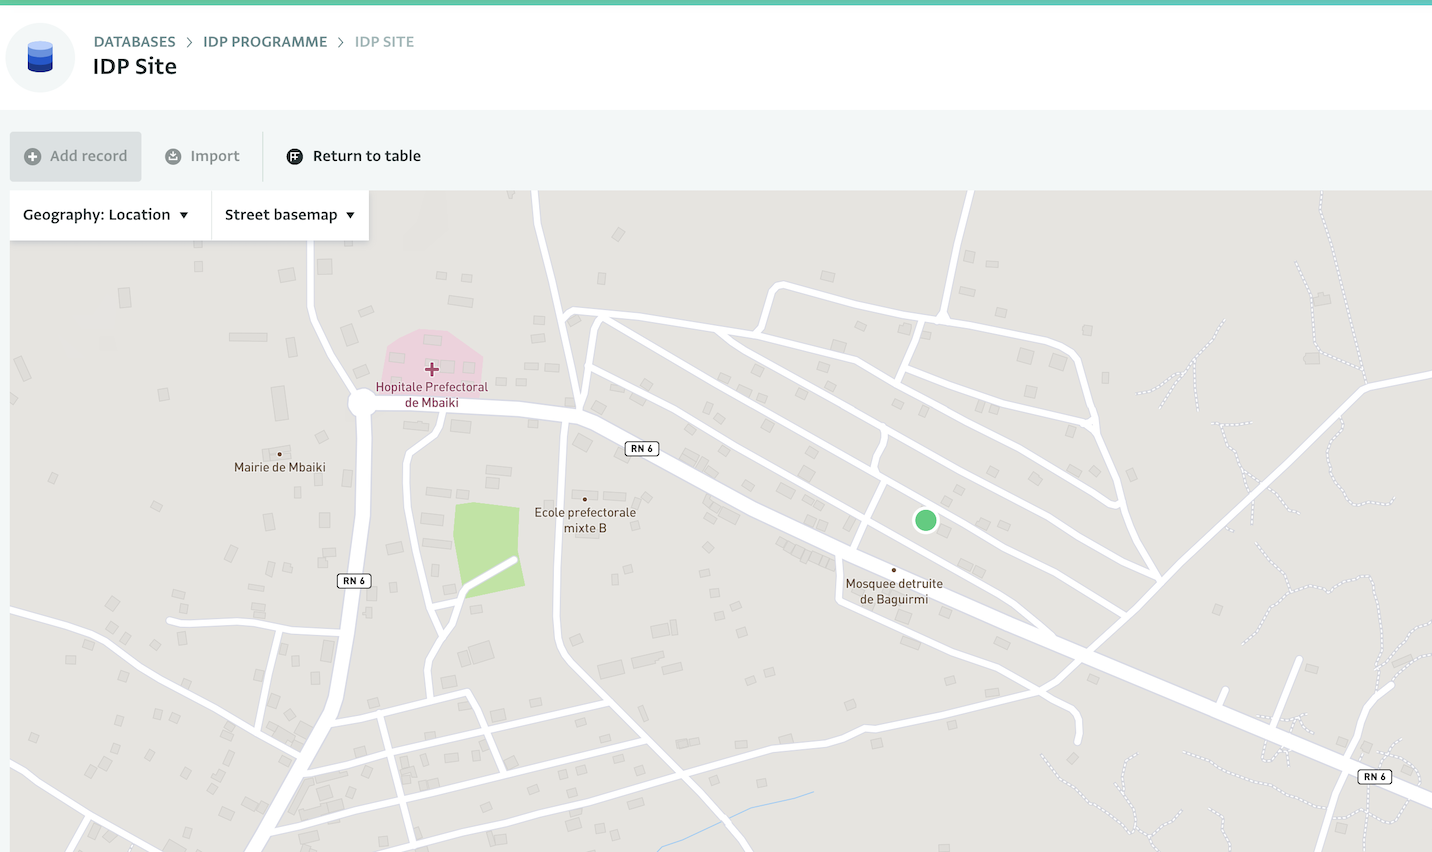
To get more information about a site and how accessible it is, switch to the Street basemap. You can also view some information about important buildings in the area.
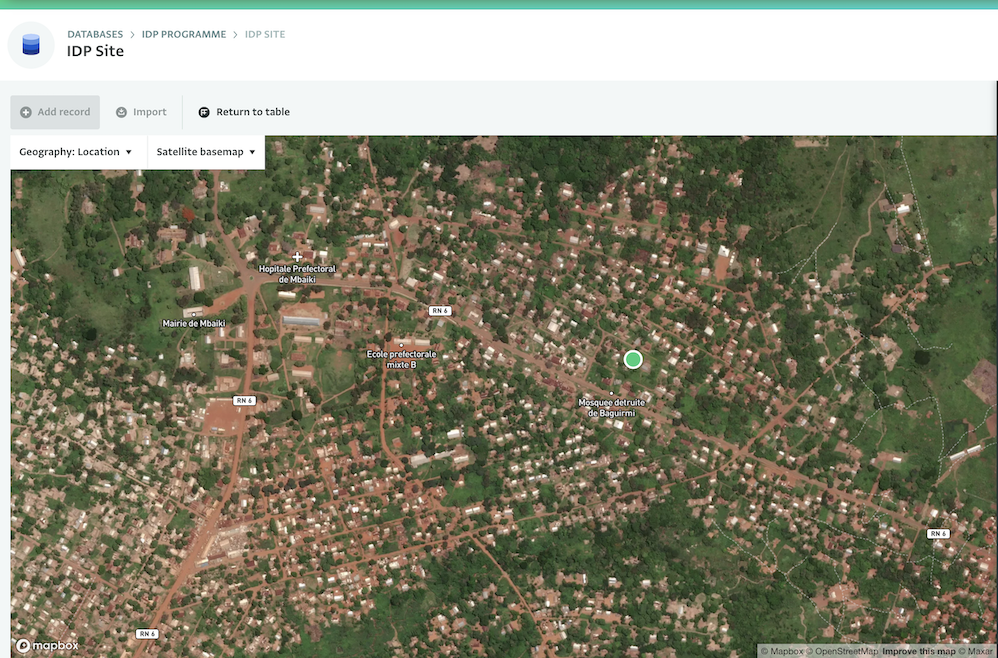
To examine the streets and the surrounding area in detail, switch to the Satellite map.
Finally, to assess the population density in the area, switch to the Population Density map (2020)
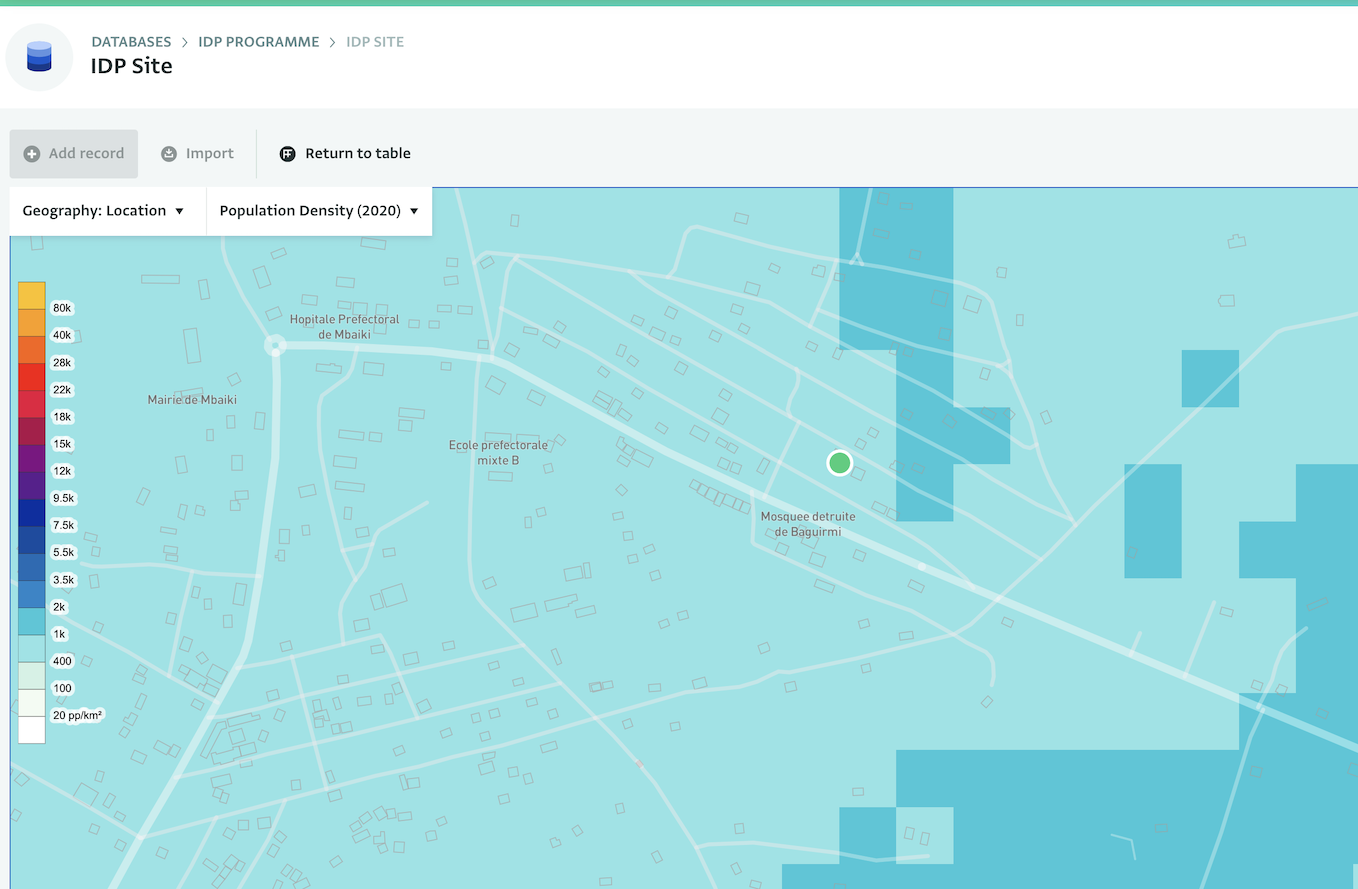
You can go back to the Table View, by clicking on the ‘Return to table’ button.
What do you think of the Maps in ActivityInfo? Will you start using them to plan your own interventions? Never hesitate to contact us if you have any questions.