Moving away from siloed systems with relational databases for monitoring and evaluation
In Monitoring and Evaluation, siloed data is an important challenge when trying to get a clear, complete picture of the impact of an organization’s activities.
For example, every team might be supporting individual rights holders with different types of activities, and as a result big amounts of data can end up scattered across different systems. Bringing together this information and the teams working with it can reveal much more insights and provide a more comprehensive overview of how each rights holder is supported.
In this article, we take a look at how a relational database, such as ActivityInfo, can support your M&E activities and help you eliminate data silos not only in your projects but also in your organization as a whole.
For a live example of how a relational database would look, you can duplicate one of the ActivityInfo database templates and explore that further.
What is a relational database model?
It is a collection of tables consisting of rows and columns, with relationships between those tables. A relational database model helps you build a complete picture of the rights holders in your project.
What is the difference between a relational database and spreadsheets (e.g. Excel, Google Sheets, etc.)?
There are various differences between databases and spreadsheets. Two important differences have to do with data quality rules and data volume:
- In a relational model, the database is more structured as data rules are enforced. For example, you cannot add a person to a training attendance list, if they are not already listed in the rights holder list linked to it.
- The databases are often designed to accommodate a larger volume of data than spreadsheets so if you have 10-15 thousand rights holders in your program, most relational database model systems can handle that.
Why and how is the relational database model better-suited to project level M&E?
1. A relational database model helps you build a complete picture of your rights holders
Let's take a look at the following example:
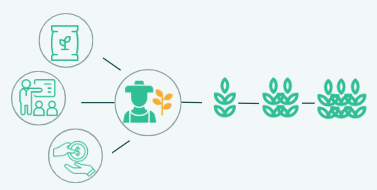
In an agriculture assistance program for farmers, you can have many sets of data such as lists of farmers, interventions you run in the program, etc.
With a relational database, you can see which farmer participated in which interventions. This is because of the relationships you can establish through the relational database.
2. A relational database model helps you organize the results your team has achieved
Then, as an M&E officer you might have to look at results in a coordinated manner in different sectors that comprise a multi-sectoral initiative.
For example, you might be running an initiative that has a WASH, an education and a health component, each with their own sets of indicators that you need to report on. This initiative is also widespread and is implemented across different provinces with separate discrete projects that you run in the field.
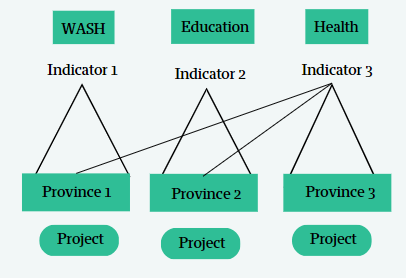
With a relational database model, you can see all the relationships between the data that you collect at the project level, attribute that to the activity that happens in a province and link it back to specific indicators that correspond to a particular sector.
3. A relational database model provides flexibility
This means that you can configure the data about the program in many different ways.
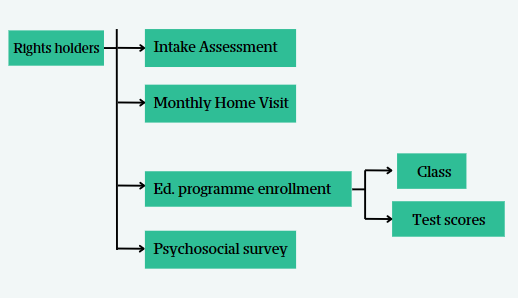
For example, you might have a central unit of analysis, centered on rights holders and within this point of analysis, you might have different attributes. You can connect these back to a particular person.
You can then see the journey a rights holder takes through this program which can start with an assessment, monthly home visits to check in on them, etc. All these attributes connect centrally to a single point of analysis allowing you to easily go back and forth with the data and still have an overview of how the project is performing.
Where can I build or experiment with a relational database?
ActivityInfo is built on the relational database model aiming to accommodate the needs of development and humanitarian operations specifically. It also offers various ready-made database templates, with which you can experiment so as to learn more.
How does the relational database model work in ActivityInfo?
ActivityInfo allows you to establish relationships between multiple data sets. This can be represented with the following columns and rows:

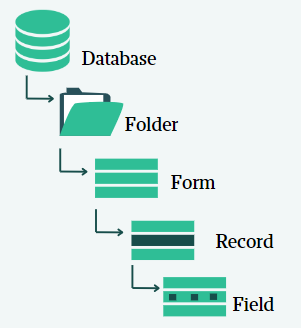
ActivityInfo has an intuitive hierarchy of organizing data allowing you to create connections between the data sets:
- Forms can be organized into folders and stored within your database where users are added so that teams can collaborate on their data.
- Records can be added to a form.
- Each record can collect information via a number of fields (i.e. text, number, attachment, date, GPS, etc.)
Breaking down data silos in practice
If you would like to see how data silos are eliminated in practice you can try one of the database templates in ActivityInfo. For example, there is a database template which allows you to explore how ActivityInfo can be used in development assistance projects. It uses as an example a programme for Promoting Pennsylvania Maple Syrup (PAMAS). After you copy this template, you can customize the database, forms and fields as well as add records to meet your needs.
The database tracks the following key indicators as outputs:
- Number of farms enrolled in the programme
- Number of individuals benefiting from assistance
- Number of individuals accessing agriculture-related financing as a result of project assistance
- Number of government staff including university employees and extension agents, trained on maple syrup production, processing and trade
In addition, we track the following key indicators for the outcomes:
- Total yield per farm increases 20% among participants
- Yield per tap increases 10% among participants by end of program
Finally, we end up tracking the following key indicators for impact:
- Pennsylvania total yield grows by 20% compared to 2019 by end of program
- 200 new farms in Pennsylvania start tapping Maple Syrup by end of program
Here’s a list of the contents of the database:

Here’s how the datasets are linked to each other using reference fields:
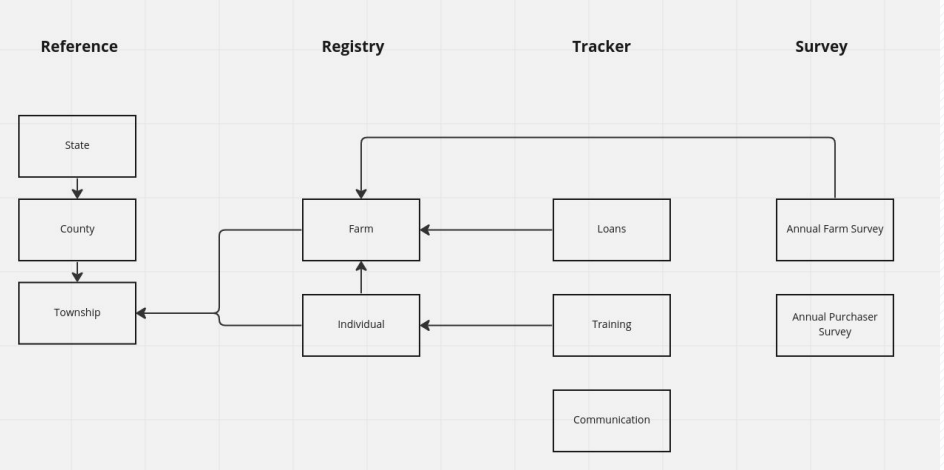
Last but not least, having such a structure allows the creation of advanced reports and dashboards using the built in analysis tools in ActivityInfo. For example, you can find reports on:
- Farm year-on-year-comparison
- Regional comparison reports
- Farmers recruitment
- Communication outreach
- Training outreach and more
Would you like to know more about how ActivityInfo can help your organization break down data silos and improve programme delivery and learning? Never hesitate to contact us!