A Pivot Table is a table of statistics that summarizes the data collected and allows data processing. In ActivityInfo users can use the data collected (Records) to create Pivot Tables.
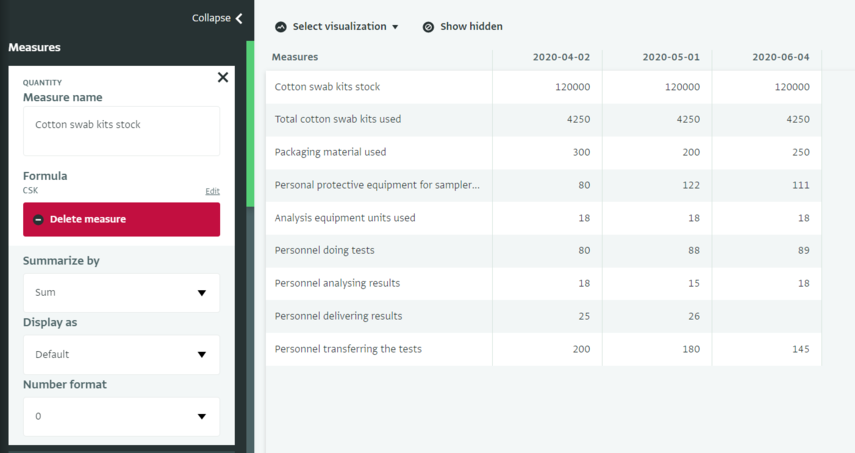
Using Measures you define the types of values you will analyse in a Pivot Table.
Using Dimensions you group Measures into one or more categories. These can appear as Rows or Columns in the Pivot Table.
Using a Statistic for a Measure, you define the way in which the values related to this Measure will be summarised (e.g. Count, Count distinct, Sum, Average, Media, Min, Max).
Using Filters you can filter what data to show on the Pivot table.
Using Categories you 'slice' your data based on a selected Dimension and customize what you view in a Pivot Table.