In this article, we explain what calculated tables are and how they can support your data analysis.
Key concepts
Tables
In ActivityInfo, Forms are organized into records and fields. However, when we do analysis, we treat the forms as a table. Each row in a table represents a record and each column represents a field. It is possible that tables that are based on Forms might not be in a structure that allows you to do the kind of analysis you need. When this happens, calculated tables allow you to rearrange your data for analysis purposes in a different format than how it was collected by allowing transformations on your data. They are created by applying formulas on existing tables.
In most cases, when we write "table", this refers to a specific form. While all ActivityInfo forms are “tables” for the purpose of calculated tables, not all tables are forms. Whenever a "table expression" is required, you can use either form id or a table function.
Calculated tables
Calculated tables allow you to transform your data from the structure in which it is collected to a structure that you would want to analyze it. During data collection, you can design your form such that it is simple to collect data and then use calculated tables to transform this data so that it is convenient to analyze. With calculated tables you can:
- Combine multiple forms into a single table
- Transform and save a new table that contains the values you need for your analysis
- Move fields or columns into rows or rows into columns
Calculated tables are created in Pivot Table reports using data from the data sources that you select. They rely on records added into existing forms in ActivityInfo. They are updated as new records are added or existing records are modified. This ensures that the calculated results stay up to date with the underlying data.
Table functions
To generate a calculated table, you must use a table function. Table functions are a special kind of function whose result is an entire table and not a single value.
Table functions generally require that you refer to a table that contains the data you need and then define the way by which you would like to transform the data.
ActivityInfo provides a range of table functions that enable you to transform your data in different ways. Common table functions include FILTER, SUMMARIZE, ADDCOLUMNS, and more. The ADDCOLUMNS AND SELECTCOLUMNS functions require that you define calculations for each column in the table.
ActivityInfo's formulas manual contains the full list of available table functions.
Examples
Here are some examples that explain how you can use calculated tables for various types of analysis:
Example 1
- You can use Calculated Tables to conduct analysis on existing tables that require further transformation prior to analysis. Further transformation can be the addition of new columns that did not exist in the original forms.
- Scenario: Suppose you have a beneficiaries table with fields such as "region", "male", "female", "elderly male" and "elderly female". While this table structure may have been convenient for data collection purposes, you might want to transform it into a more convenient table that aggregates the different beneficiaries categories under a new column named "gender".
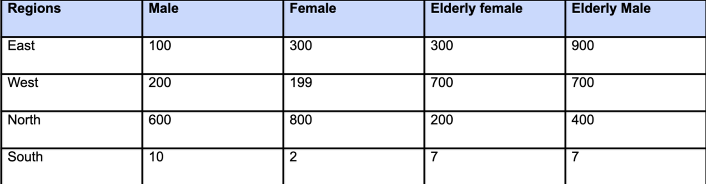
- Using a calculated table, you can use the PIVOTLONGER function to transform a table, moving some of its columns to rows. For instance, in this example, we have a form with aggregate values by gender (Female, Male, Elderly Female, and Elderly Male), and we want to transform this to a table that is convenient for analysis.This formula creates a calculated table by adding a new column to an existing table:
PIVOTLONGER(c4m0o1oln4h8vt1v, COLUMNS(Male, Female, [Elderly female], [Elderly male]),"Gender","count")
Let's break down the formula step by step:
- PIVOTLONGER: This function is used for transforming data from a wide format (where each category or variable has its own column like Male, Female, [Elderly male], [Elderly female] ) into a long format (where data is stacked in a single column with accompanying labels).
- c4m0o1oln4h8vt1v: This represents the existing form to which you are adding the new calculated column.
COLUMNS(Male, Female, [Elderly female], [Elderly male]): This part specifies the values from the wide-format data that you want to pivot. In this case, we want to pivot the columns "Male," "Female," "Elderly Female," and "Elderly Male". in order to group the values under one column."Gender": This is the name you want to assign to the new column that will contain the gender labels after pivoting. This column will indicate the gender of the data in the wide-format columns."count": This is the name you want to assign to the new column that will contain the values from the wide-format columns. In this case, we want to count the occurrences of each gender category across the regions.
Pivot table using Calculated Table
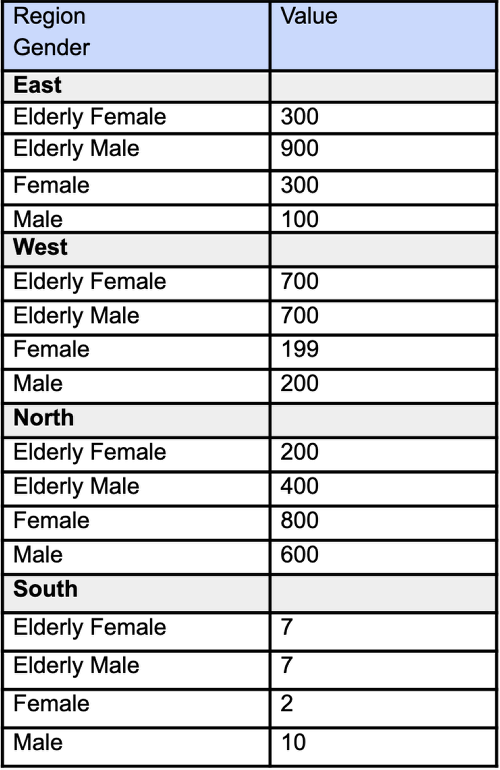
In summary, the formula is used to transform data from a wide format into a long format. It specifically selects columns "Male," "Female," "Elderly male," and "Elderly female" from the dataset represented by "c4m0o1oln4h8vt1v" and pivots them into two new columns: "Gender/Region" and "count(value)." The "Gender" column will contain labels (e.g., "Male," "Female") to indicate the gender category, and the "count" column will contain the corresponding counts of occurrences for each category.
Example 2
You can use Calculated Tables Combine multiple tables into a single table for analysis.
Scenario: Suppose you have two forms;
Medical Outreach Activity
Food Distribution Activity
And you want to combine both forms in order to transform two tables(forms) into one single table for analysis. Using the
UNIONfunction to combine the results of twoSELECTCOLUMNSfunctions, you can create a calculated table that is more convenient for analysis.
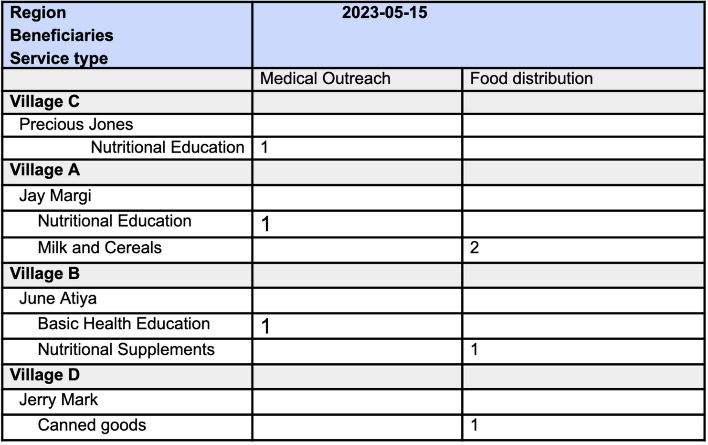
Food Distribution Activity
Medical Outreach
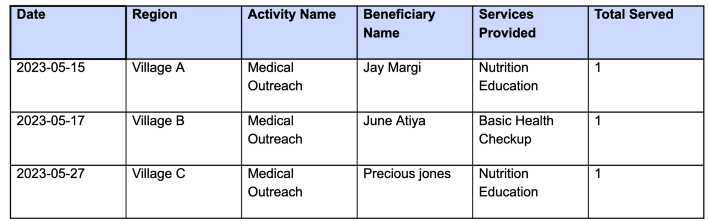
- Using a calculated table, you can use the UNION function to combine both tables into a single table .This formula will transform multiple tables into one single table for analysis:
UNION(
SELECTCOLUMNS(cxc6nf3ln7yqo882 ,"Beneficiaries", BName, "Region", Region,"Date",Date,"service type",SP,"Count", TBR,"Activity", AN),
SELECTCOLUMNS(c55so8eln7y90r0a  ,"Beneficiaries", BType, "Region", Region,"Date",Date ,"service type",SP,"Count", TS,"Activity", AN))
Let's break down the formula step by step:
UNION(): This is the outer function that combines the results of twoSELECTCOLUMNSfunctions into a single table. It stacks the rows from bothSELECTCOLUMNSresults on top of each other to create a unified table.SELECTCOLUMNS(): This is a function used to create a new table by selecting specific columns from an existing table. It allows you to reshape the data by choosing which columns to include and giving them new names if desired.cxc6nf3ln7yqo882andc55so8eln7y90r0a: These are references to two different tables (form Id) from which you want to select columns and create a unified table.- "Beneficiaries", "Region", "Date", "service type", "Count", and "Activity": These are the names you've given to the columns you want to select from the source tables. You are essentially renaming the columns in the new table.
- BName, Region, Date, SP, TBR, and AN: These are the actual column values you are selecting from the first source form (cxc6nf3ln7yqo882) and assigning them to the corresponding column names you specified. For example, BName is mapped to "Beneficiaries", Region is mapped to "Region", and so on.
- BType, Region, Date, SP, TS, and AN: These are the actual column values you are selecting from the second source form (c55so8eln7y90r0a) and assigning them to the corresponding column names you specified. Similar to the first SELECTCOLUMNS function, you are renaming the columns here as well.
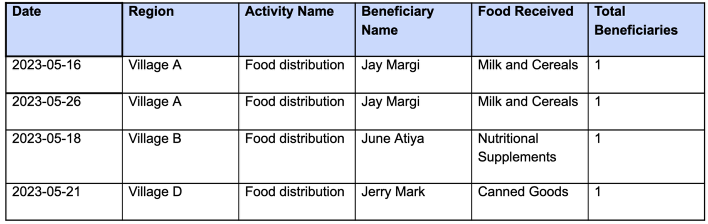
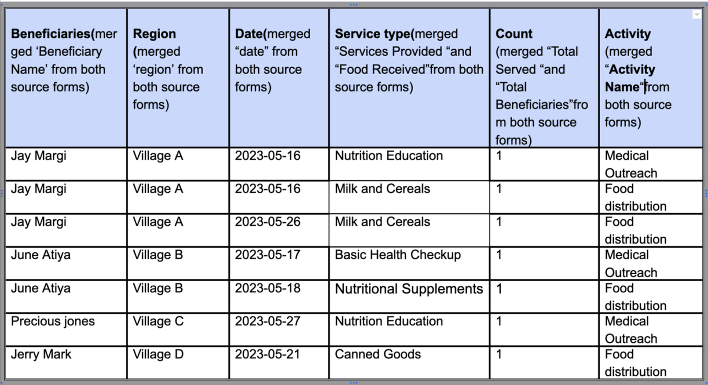
The formula is essentially taking two separate tables, cxc6nf3ln7yqo882 and c55so8eln7y90r0a, and creating a unified table by selecting specific columns from each of them and giving them new names in the new table. The new table will have columns like "Beneficiaries," "Region," "Date," "service type," "Count," and "Activity," containing data from both source forms. This allows you to analyze and compare the data across these columns. The resulting table would look something like this:
Creating a Pivot Table Report with measures and dimensions from the Calculated Table
In your pivot table;
Drag the count to measure
Drag "region", Beneficiaries and "service type" as row dimensions.
Drag "Date" and "Activity" as column dimensions.