Enhanced data analysis features for complex indicator calculations
In addition to centralizing data collection and data management, ActivityInfo aims to make it easier for professionals to centralize data analysis and reporting too.To support organizations that face advanced data analysis needs, we have been working on a series of improvements and new features for complex indicator calculations, with the support and contribution of ACDI/VOCA.
By performing advanced calculations in the same platform where the data is collected and managed you can enhance data governance. You can get useful insights from your primary data and showcase how every indicator has been calculated, all in the same place. Instead of keeping indicator definitions trapped in files, you can make them easily accessible to all relevant stakeholders and collaborate faster and in a more transparent way.
Calculated measures and DAX functions
Calculated Measures allow you to:
- Combine data from more than one form in a single measure.
- Use different types of aggregations together in the same measure.
- Aggregate data several times at different levels
Other examples:
- If you have one form with a list of training workshops and another form with a list of training sessions you can combine them and get the total number of training events.
- If you have forms that collect teachers’ and students’ data, you can find the student-teacher ratio by dividing the sum of teachers by the sum of students.
- If you have a form with beneficiaries participating in activities, you can write a formula that lets you add up the number of beneficiaries at the district level, find the maximum for each activity within the district, and then add up those maximums to get the total at the country level.
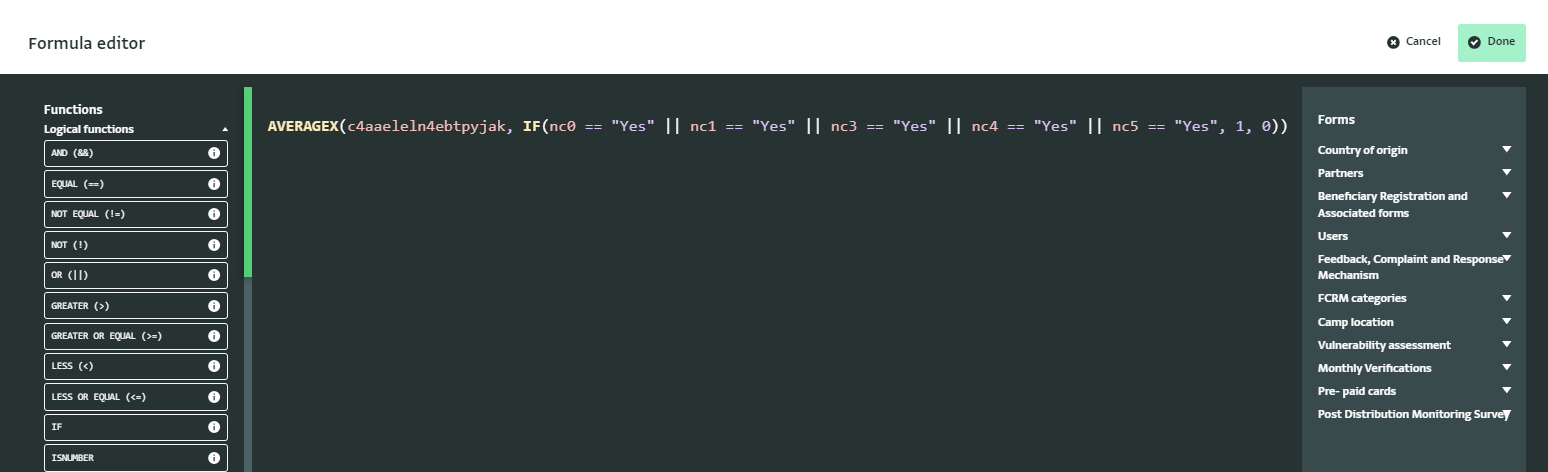
Every Calculated Measure must include an aggregation function, such as SUMX, AVERAGEX, COUNTX, COUNTDISTINCTX, MINX, MAXX, etc. Take a look at a list of newly supported functions for formulas in the section ‘New functions for formulas’.
The Calculated Measure language in ActivityInfo is inspired by PowerBI’s Data Analysis Expressions (DAX) language and the popular dplyr R package.
Learn more in the documentation:
- Understanding Calculated Measures
- Tutorial: Add a calculated measure
- Understanding Calculated Tables
- Tutorial: Add a Calculated Table
Watch the sessions:
- Understanding formulas and Pivot Tables for Calculated measures in ActivityInfo
- Discover the power of Calculated measures in ActivityInfo
Calculated tables
With Calculated tables you can transform and combine your data into more useful structures that allow for different kinds of analysis.
You can:
- Group records together to create new, useful categories
- Filter a table to include only the relevant subset of records
- Combine multiple tables into a single table
There are two steps to use a Calculated table for enhanced analysis:
- Define and save a new table that contains the measures you need for your analysis. To create a table you need to use Table functions. Common table functions include FILTER, SUMMARIZE, and ADDCOLUMNS.
- Once created, use the fields of the Calculated table as dimensions in your Pivot table.
Tip: Do you need to bring records to your analysis that exist in other forms which are not related by a reference field? With the LOOKUP() function, you can “lookup” values from other forms that are not related by a reference field. For example, you can look up exchange rates by date, or targets by a combination of fiscal year and gender.
New functions for formulas
We added support for new functions for formulas for complex indicator calculations.
Aggregation functions:
- SUMX()
- MINX()
- MAXX()
- COUNTDISTINCTX()
- COUNTX()
- AVERAGEX()
- LASTX(): Returns a value from the last result encountered, after sorting.
- FIRSTX(): Returns a value from the first result encountered, after sorting.
Based on record context:
- LOOKUP(): “Lookup” values from other forms that are not related by a reference field. For example, look up exchange rates by date, or targets by a combination of fiscal year and gender.
Table functions:
- PIVOTLONGER()
- UNION()
- SUMMARIZE()
- FILTER(): Returns a table that represents a subset of another table or expression.
- ADDCOLUMNS(): Returns a new table with additional columns added to the specified table.
- SELECTCOLUMNS(): Reorders, renames and selects columns from the specified table. Filter-context functions:
- CALCULATE: Changes the filter context of an expression with the specified filters.
- ALL: Removes all filters, or all filters on a specific form or tables, on the filter context of an expression.
More updates for efficient Pivot tables
- Filters for Pivot Tables
- Updated number formatting for measures
- We removed the option to add multiple statistics for Measures for a single field. As an alternative, you can add the same field twice with different statistics.
- Improved display of quantity values in measure results and totals.
- Percentages are now a property of measures rather than dimensions and can be evaluated against row, column or grand totals.
The ActivityInfo team would like to thank ACDI/VOCA for their support and contribution for the development of these features.