The added value of reporting with ActivityInfo: a case-study
One of the key values of ActivityInfo is to provide value for each person regarding the data they report. Often Information Management (IM) or Monitoring & Evaluation (M&E) systems are initiated to apply to donor or headquarter requirements, to justify the activities being conducted or the money spend.
ActivityInfo moves beyond this paradigm. Yes, obviously M&E officers can obtain their required overview, follow up of country offices as well as generate the reports for donor agencies. However, very often NGOs and partner agencies feel obligated to report. Many of these agencies face an one-way-highway for reporting data. ActivityInfo, however, provides value to everybody. Not many agencies might currently make use of this power, since it is often forgotten -or unknown- by implementers to train NGOs and collaborative partners to generate maps, as well as other reports, themselves.
The maps you can generate with ActivityInfo provide a simple, fast and real-time insight in the core questions regarding your projects and programs. For example, how are your programs currently addressing the objectives as stated? Easy and simple analysis on the impact or gaps in your programs. I will explain this in a simple case what ActivityInfo can provide and how this can support you, and your partners, in your work.
Case: Simple insight regarding impact, coverage and progress of Malaria activities
Case description: Imagine you are a program officer of a NGO called EMN (Eradicat Malaria NOW – a fictitious NGO). You are working in an endemic Malaria region in the Kivus in the Democratic Republic of Congo. Your primary activities are bednet distributions with outreach and sensitisation, as well as training and supporting health facilities (supervised by the MoH, Ministry of Health) with free Malaria treatment.
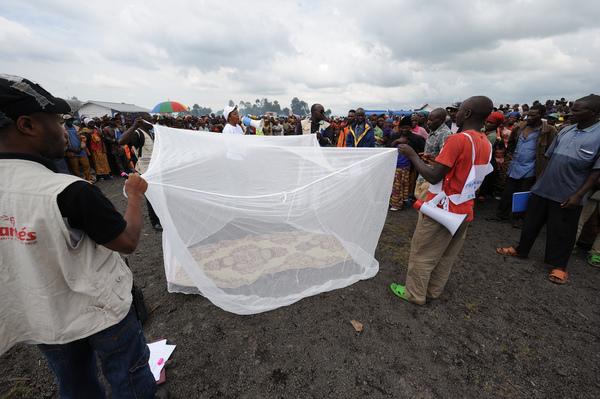
The distribution and sensitisation campaigns are funded by a major UN agency who requests you to report in ActivityInfo, like all other partners working in a country-wide operation called: Malaria Response DRC. You have been reporting on a weekly basis your bednet distributions in ActivityInfo over the last two years.
At the same time your agency works with the MoH (Ministry of Health). You are monitoring the case load of Malaria patients. The data you have are the number of patients treated in each of the health facilities. You are doing so in your spreadsheets. You receive grant money from USAID, a large donor, for this project. You have decided recently to also start reporting this data in ActivityInfo. This database you also share with the MoH.
Having these two data sets, ActivityInfo gives you the power to combine the data from these two databases visually for simple and powerful analysis.
Your Malaria Maps provided by ActivityInfo
You can create a map in ActivityInfo (see image 2 below) showing the number of bednets distributed per village (proportional circle), and the case load of malaria per ‘territoire’ (administrative level 3 in the DRC) (shaded polygon) of June and July.
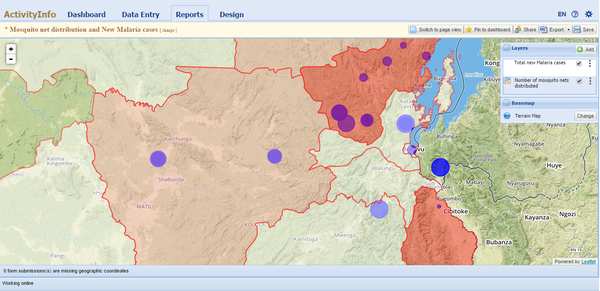
Looking at your map you quickly realize that you encounter a large case load in the ‘territoire’ Ulvira (in the south east, dark red region). However, there is a very limited response with bednet distributions. This visual representation of the gap in the response might help you to generate support from partner organisations to step in or secure financial support to address the immediate needs you have identified.
Another example could be (not visual in the map above): imagine you have conducted a very large distribution campaign in a certain province, with a calculated coverage of 95% of the population. However visually you notice that in one particular region there is still a very high case load, you could start raising questions:
- Have the bednets reached the population it targeted?
- Has the coverage rate been accurately calculated?
- Are the bednets properly used?
- Are the bednets in use at all?
- What was the sensitization/training campaign like?
Wrap up
Working in humanitarian aid by nature is working under enormous time pressure and we are always in shortage of time. Your aid respons to serve those in need is obviously your first priority. Reporting and justification to donors and counterparts will still be one of your key obligation. However, by having multiple datasets in ActivityInfo it can really empower you, your partners and your programs. Being able to share data (in real time) of your programs within your agency, eg with other divisions or programs, allows you to have a visual overview within seconds. Being able to do a visual gap analysis on ongoing programs or on your planning really helps you to be more effective in your monitoring, reviews and meetings.
If you need help to generate your reports, specifically maps please take a look at our online material here. If you need help to set up other databases, without being a technical experts, to make the most of your use of ActivityInfo you can take a look here.
We love to hear from you how ActivityInfo mapping helps you in your daily operations, planning or M&E. Please contact us if you like to share your case in a blog and share your experience with ActivityInfo users worldwide.